All published articles of this journal are available on ScienceDirect.

Mean Corpuscular Volume as a Marker for Adherence to Zidovudine-Containing Therapy in HIV-Infected Adults
Authors Info & Affiliations
Abstract
Objectives:
To assess whether mean corpuscular volume (MCV) is useful in detecting non-adherence to AZTcontaining therapy.
Design:
Observational study within randomised controlled trial.
Methods:
We combined data from two treatment arms in SPARTAC, an RCT of short-course cART in primary HIV infection, classifying participants as responders (HIV-RNA decrease ≥1 log10 or reaching <400copies/ml) or nonresponders following cART initiation. We assessed the sensitivity and specificity of using different percentage increases in MCV for accurately differentiating between responders and non-responders. We further examined changes in MCV levels up to 24 weeks after protocol-indicated cART cessation.
Results:
Of 119 participants included in this analysis, 73 (61%) were women, 71 of whom were randomised in Africa. Ninety-eight (88%) and 84 (85%) were classified as responders at 4 and 12 weeks respectively following cART initiation. MCV increased by a mean 3% and 1% at week 4, and 14% and <1% at 12 weeks for responders and non-responders. A 2% MCV increase at 4 weeks had 62% sensitivity and specificity for identifying virological response. At 12 weeks, an 8% increase had 89% sensitivity and specificity. In responders, MCV remained lower for individuals in African compared to non-African sites throughout and rose from 85 vs 90 fL at cART start to 96 vs 103 fL at 12 weeks post-initiation then fell to 88 vs 93 fL and 86 vs 89 fL at 12 and 48 weeks post-cessation.
Conclusion:
In low-income countries, where HIV RNA may be unavailable, 12-weekly MCV measurements may be useful in monitoring adherence to AZT-containing regimens.
INTRODUCTION
The main aim of combination anti-retroviral therapy (cART) in HIV infection is the suppression of viral replication resulting in an improvement in immune function and clinical outcomes [1, 2]. Viral suppression, as measured by HIV RNA quantification, provides crucial information for monitoring the efficacy and success of cART and reflects treatment adherence. Maintaining a high level of adherence to cART is the most important predictor of therapeutic success, in terms of restoration of immune function and improvement of overall survival [3].
In high-income country settings, HIV RNA is generally performed 3-4 times per year once patients initiate cART. Currently at $20-50 per assay, excluding laboratory costs, however, the test is generally not affordable in countries with the world’s heaviest HIV burden, sub-Saharan Africa. Current standard recommendations for assessing and initiating second-line ART in this setting suggest waiting until clinically-overt immunological function has deteriorated [4], by which time extensive resistance may have developed [5], compromising the efficacy of first-line therapy. Early detection of reduced adherence to cART, with appropriate support, could potentially reverse this scenario, and may confer enhanced potency of first-line regimens. Given that, in most Sub-Saharan African settings, there are only two widely-available ART lines of therapy, preservation of function of first- line, usually also more cost-effective [6], is highly desirable. Alternative methods for assessing adherence have been sought which can be used before clinical manifestations of profound immune compromise are evident.
Although a number of methods for assessing adherence to medication are available, these mostly rely on self-reporting and may not be indicative of true levels of adherence as they are subject to reporting bias [7-10]. One biological test which has been proposed is the comparison of erythrocyte size, as determined by the mean corpuscular volume (MCV), measured pre-treatment and following initiation. MCV measurement is standard on modern fully-automated haematology instruments that use light scatter technology. A dilute red cell suspension passes single file in front of a light source and scattered light is detected by a photomultiplier and is converted to an electrical impulse. The degree of scatter is proportional to the surface areas of the erythrocyte thus providing an estimation of cell volume. MCV is an important initial test in the assessment of anaemia and is the standard test for the diagnosis of micro and macrocytic anaemia [11], which was observed to occur when nucleoside reverse-transcriptase inhibitor drugs (NRTIs), particularly zidovudine (AZT) and stavudine (d4T) are used to treat HIV infection [12-15].
MCV has been proposed as a surrogate marker of adherence to zidovudine. However, its usefulness as an adherence measure has never been adequately assessed. There has been some focus on the association of MCV levels with self-reported adherence [12, 13] and HIV RNA levels while on therapy [16] which have shown that MCV levels rise linearly for approximately the first 24 weeks of adherent treatment before reaching a steady state, and that both MCV absolute value, and change from baseline at time points after this, are highly associated with HIV RNA levels. However, it has not been confirmed whether, and for how long, MCV levels remain high following the cessation of therapy.
We evaluate MCV levels while on cART and after stopping it in participants enrolled onto SPARTAC, a randomised controlled trial of short-term therapy in primary HIV infection (PHI). HIV RNA and MCV levels were measured at all trial visits including randomisation, on cART, upon protocol-indicated stopping of cART, and thereafter.
METHODS
We used data from SPARTAC (Short Pulse Anti-Retroviral Therapy At HIV Seroconversion- ISRCTN76 742797), an international multi-centre randomized controlled trial comparing three different strategies of intervention in PHI; 12 weeks of cART, 48 weeks of cART, or no ART. Enrolment for SPARTAC was completed in July 2007 and the trial reported in July 2011 [17]. The study includes 366 patients from two African countries (Uganda and South Africa) and several sites in Europe (UK, Ireland, Spain, and Italy), as well as Australia and Brazil.
At each visit, HIV RNA was measured and blood specimens collected to measure a variety of laboratory parameters. Full blood counts (FBC) and MCV were performed using one of four analyzers; Beckman Coulter AcT 5 Diff (Beckman Coulter Inc, Fullerton, CA), Coulter LH 750 (Beckman Coulter Inc) Sysmex XE-2100 (Sysmex, UK), or the Advia 2120 haematology system (Siemens Healthcare diagnostics Inc) [18]. As samples were stored at 4-8 ºC and processed within 10 hours, any variation by analyzer used is likely to be minimal [19].
Participants were also requested to complete a self-administered adherence questionnaire at each visit.
The trial was approved by ethics committees in each of the participating countries and participants signed a written informed consent.
Statistical Methods
SPARTAC participants randomised to 12 or 48 weeks of AZT-containing cART, in whom pre-treatment MCV was measured, were eligible for inclusion in the current analyses. Subjects with a baseline HIV RNA <400 copies/ml were excluded. We describe MCV at baseline and 4 and 12 weeks after initiation of cART. Measurements had to be taken within a two-week window of each time point. Participants were classified as responders if they achieved an HIV RNA <400 copies/ml or a decrease ≥1 log10 at weeks 4 and12 and at cessation of their allocated cART, as a proxy for adherence, and non-responders otherwise. Data for the analysis of MCV on cART are censored at cART cessation.
Using the pre-cART MCV level as baseline, the percentage change in MCV after 4 and 12 weeks was calculated. The sensitivity and specificity of the change in MCV in correctly differentiating responders from non-responders was assessed using the change in HIV RNA level as the gold standard. We also undertook a sensitivity analysis using a stricter definition for response (HIV RNA <400 copies/ml or a decrease ≥2 log10 copies/ml).
We also compared self-reported adherence levels at weeks 4 and 12 from the question “During the past 4 days, on how many days have you missed taking all (or part) of your doses?” against our classification of virological response as well as MCV levels.
Furthermore, we described changes in MCV levels 4, 12, and 24 weeks (within 2 weeks) following the cessation of cART and compared these to levels at cART cessation. For participants on the 12-week cART arm, this was at the 16, 24 and 36-week visits, respectively. For those on the 48-week arm the corresponding visits were at weeks 52, 60 and 72. Follow-up was censored at the re-initiation of cART if earlier. Analysis post cART cessation was restricted to participants who had achieved virological response.
RESULTS
Of 243 SPARTAC participants randomised to short-course cART, 152 were given AZT-containing regimens. MCV values at baseline were available for 136 (89%) of whom 17 (12.5%) had a baseline HIV RNA <400 copies/ml and were, therefore, excluded from analyses. For the remaining 119, most (61%) were women, median (IQR) age at cART initiation was 29 (24, 38) years and BMI 24 (22, 28) kg/m2. Median time elapsed between estimated seroconversion and cART initiation was 86 (70, 111) days at CD4 and HIV RNA of 525 (421, 679) cells/mm3 and 4.5 (4.0, 5.1) log10 copies/ml, respectively, and median MCV 87 (82, 90) fL. Baseline MCV levels according to patient characteristics are presented in Table 1 and were lower among women, the majority of whom (71 of 73) were randomised from African sites.
Baseline Characteristics and Median Corpuscular Volume in SPARTAC Participants on AZT-Containing cART
| N | Median [IQR] MCV | |||
|---|---|---|---|---|
| Sex | Male | 46 | 90 | (87,92) |
| Female | 73 | 85 | (81,88) | |
| Exposure category | Sex between men | 40 | 90 | (88,93) |
| Sex between men & women | 79 | 85 | (81,89) | |
| Age (years) | <25 | 40 | 87 | (83,90) |
| 25-29 | 23 | 85 | (82,90) | |
| 30-34 | 16 | 86 | (81,90) | |
| 35-39 | 13 | 89 | (87,91) | |
| ≥40 | 27 | 88 | (81,91) | |
| Body Mass Index (kg/m2) | <20 | 10 | 87 | (81,91) |
| 20-24 | 56 | 88 | (84,91) | |
| 25-29 | 26 | 87 | (83,91) | |
| ≥30 | 23 | 84 | (81,87) | |
| missing | 4 | 88 | (85,92) | |
| CD4 cell count (cells/mm3) | <350 | 18 | 88 | (84,91) |
| 350-499 | 35 | 85 | (80,90) | |
| 500-749 | 45 | 87 | (83,90) | |
| ≥750 | 21 | 89 | (86,91) | |
| Log10 HIV RNA (copies/mL) | <3 | 6 | 88 | (82,90) |
| 3-4 | 26 | 86 | (83,90) | |
| 4-5 | 52 | 87 | (83,89) | |
| ≥5 | 35 | 88 | (82,91) | |
| Country | African | 71 | 85 | (81,88) |
| Non-African | 48 | 90 | (87,92) | |
The majority (95%) of participants started allocated cART on a regimen of zidovudine, lamivudine, and ritonavir-boosted lopinavir. One participant was additionally prescribed enfuvirtide and five participants were prescribed didanosine instead of lamivudine.
Changes in MCV Levels while on AZT-Containing Regimens
Four weeks after initiation of cART, 98 (88%) of 111 participants with available HIV RNA results were classified as responders of whom 62 (63%) had achieved an HIV RNA <400 copies/ml (indicated by ● in Fig. 1a). By 12 weeks, 84 (85%) of 99 with available HIV RNA results were classified as responders, of whom 76 (90%) had achieved an HIV RNA <400 copies/ml (Fig. 1b). MCV data were missing for 9 and 20 participants at weeks 4 and 12, respectively and, for the remaining participants, MCV levels increased to a median 89 (85, 92) at 4 weeks and 98 (92, 103) at 12 weeks, equivalent to mean overall increases of 2.5% (95% CI: 2.0, 3.0) and 12.6% (11.2, 13.9) at those two time points, respectively.
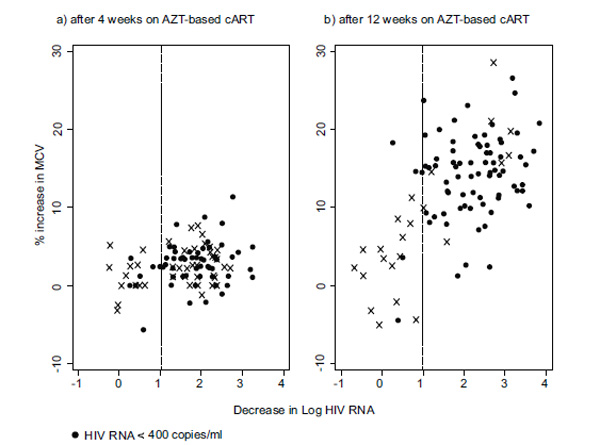
Changes in HIV RNA and MCV following initiation of cART at (a) week 4 and (b) week 12. Note: vertical line denotes 1 log drop in HIV RNA from baseline value separating virological responders from non-responders.
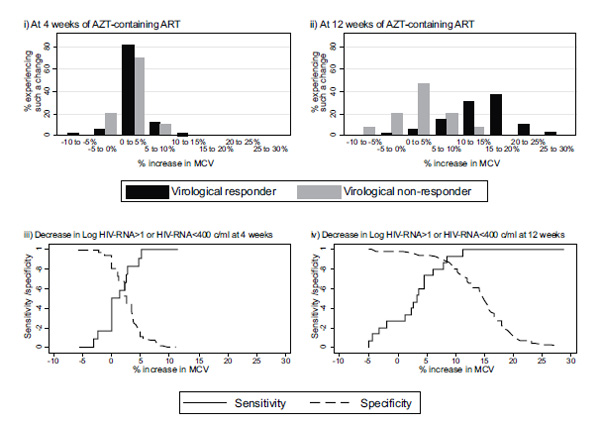
Percentage changes in MCV levels from baseline at (i) week 4 and (ii) week 12 for virological responders* (black) and non-responders (grey), and sensitivity and specificity for use of change in MCV from baseline to correctly identify virological response at (iii) week 4 and (iv) week 12. * ≥1 log10 drop in HIV RNA from baseline or achieving <400 copies/ml.
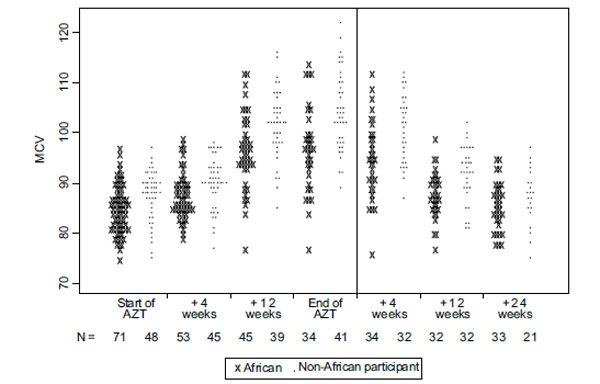
Absolute MCV levels over time on AZT-containing regimens and upon cessation for participants achieving ≥1 log10 drop in HIV RNA or reaching <400 copies/ml at cessation of their allocated cART (i.e. 12 or 48 weeks). Note: data from all participants at baseline are included, and at 4 and 12 weeks after start of AZT-based cART only for those classified as responders at those time points. Levels after the cessation of AZT-based cART are only included for participants classified as responding to treatment at the cessation of their allocated course of therapy (i.e. 12 or 48 weeks).
Considering responders and non-responders separately, as defined at the relevant week, 4 weeks after starting cART, median MCV value was 90 (85, 93) and 83 (80, 91) fL for the two groups, respectively, corresponding to mean rises of 2.6% (95% CI: 2.2, 3.2) and 1.1% (-0.6, 2.7). At 12 weeks, the difference between responders and non-responders was much more evident with median MCV levels of 99 (94, 105) and 89 (84, 91) fL, equivalent to a mean rise of 14% (95% CI: 12.7, 15.1) and 0.3% (-0.3, 3.0) for responders and non-responders, respectively (Fig. 2i, 2ii).
The sensitivity and specificity for the use of each incremental change in MCV level against virological response are also shown in Fig. (2iii, 2iv). A 2% increase in MCV levels at 4 weeks has a sensitivity and specificity of 62%. At week 12, an 8% increase in MCV levels from baseline has a sensitivity and specificity of 89%. Given the prevalence of non-response in our population at 12 weeks, such a rise has a negative predictive value, i.e. proportion identified as responders who are in fact responders, of 97.9%, and a positive predictive value of 58.8%.
Restricting the definition of response to a drop in HIV RNA of ≥ 2 log10 copies/ml or reaching <400 copies/ml, 80 (73%) and 81 (82%) of participants were classified as responders at weeks 4 and 12, respectively. This resulted in virtually no difference in sensitivity and specificity scores for different cut-off values of MCV percentage increase (results are not shown).
Comparing reported adherence from the questionnaire with virological response, data were available from 102 participants at week 4, of whom 90 (88%) reported not missing medication in the last 4 days. 89% of responders and 71% of non-responders reported never missing any days, and 1% of responders and 29% of non-responders reported missing medication on all 4 days. By 12 weeks, however, reported adherence was still generally high with, 97% (81 of 83) of responders and 100% (12 of 12) of non-responders reporting missing, at most, one day of medication in the last 4. Seventy-four (89%) and 11 (92%) responders and non-responders, respectively, reported never missing medication at 12 weeks.
At 4 weeks, median MCV levels for responders who had reported missing no days of treatment in the last 4 were similar to responders who had reported at least one day of missed therapy (89, 77- 99 vs 88, 78- 98 fL, respectively). Levels were likewise similar for the two groups at 12 weeks (98, 75- 117 and 95, 81- 106 fL).
Changes in MCV Levels on the Cessation of AZT-Containing Regimen
MCV levels for Africans continued to remain lower than that of their counterparts from non-African sites throughout. Changes in absolute MCV levels from cART initiation to 24 weeks after its cessation are shown in Fig. (3) separately for participants randomised at African and non-African sites.
For the 75 participants who were virological responders to therapy (at cessation of cART) MCV data were missing or censored for 9 (12%), 11 (15%) and 21 (28%) participants 4, 12, and 24 weeks, respectively, after cART cessation.
At 4 weeks post cART cessation, median MCV levels remained high at 95 (90, 100) and 103 (95, 107) fL for Africans and non-Africans, respectively. By week 12, 28 (82%) and 19 (58%) of Africans and non-Africans had experienced a decrease of ≥8%, compared to levels at cessation, and by 24 weeks these figures were 22 (96%) and 25 (74%) respectively. This cut-off of 8% had a sensitivity and specificity of 89% for differentiating responders and non-responders (Fig. 2iv).
DISCUSSION
Using data from participants enrolled in a randomised controlled trial with protocol-indicated cART cessation, we have shown that MCV levels may be useful in, not only identifying non-adherent, virologically non-responding patients, but also individuals who are not responding despite high adherence rates. A rise of at least 8% in MCV levels 12 weeks after initiation of cART correctly identifies almost 90% of virological responders, and a rise of <8% identifies the same proportion of non-responders. This correlates with previous findings [16] and is valuable information given that a full blood count is easily performed and readily available in low-income countries and at, around $2, is a fraction of the cost of an HIV RNA measurement (P Kaleebu- personal communication). MCV levels could assist healthcare providers in identifying individuals who are not responding to AZT-based therapy, because of poor adherence, or even in spite of good adherence.
We observed a 2% rise in MCV levels at 4 weeks after starting cART suggesting a delay between virologic response and a change in MCV level. This is not surprising given the 120-day average life span of an erythrocyte, suggesting that testing should occur at least 60 days from initiation of treatment i.e. when 50% of the red cell population would have been produced since cART initiation and a more significant rise could be expected. At any rate, using MCV levels to assess response to cART at such an early stage seems inappropriate. Indeed, we found that there is poor differentiation between those who experienced a fall in HIV RNA and those who did not. At best, a 2% rise in MCV, equivalent to the median rise attained by responders, at this stage is able to correctly identify only 62% of non-responders.
At 12 weeks, however, a much greater increase in MCV level was observed for responders (14% vs 0.3% for non-responders). MCV levels at this stage were much higher with median 96 and 103 fL for Africans and non-Africans, respectively, with at least 25% of participants in both groups attaining MCV measurements >100 fL.
We also observed that MCV levels in individuals randomised from the African sites were lower throughout compared to those of participants randomised from other sites, and in comparison with normal limits reported from high-income countries [20, 21]. Furthermore, once cART was stopped, a large decrease in MCV levels was experienced by a far bigger proportion of Africans, compared to non-Africans (82% vs 58%). These absolute levels and expected MCV decrease should be borne in mind when clinicians are assessing likely adherence in their patients, and raise the possibility that even initially adherent patients may no longer be taking their medication.
Ethnicity data were not collected in SPARTAC but we have assumed throughout that non-Africans were enrolled in non-African sites and only Africans were enrolled from African sites. Indeed, all those enrolled at sites in Uganda and South Africa were African women, the majority of whom had been enrolled on a trial to assess the efficacy of PRO2000, a microbicidal gel, with those seroconverting being offered the possibility of enrolling onto SPARTAC [22]. Their ethnicity is, therefore, recorded. At the non-African sites, however, a degree of misclassification may have occurred which is likely to have tended to decrease the population average MCV level. This is unlikely, however, to have impacted on our main findings.
Additionally, we have been unable to adjust for iron levels, thalassaemia, folate or B12 deficiency, or other medications (including septrin and antiepileptics) which may affect MCV levels.
In the absence of HIV RNA measurements, patient-reported adherence is often relied on. We found that this was not helpful in differentiating between those who virologically respond and those who had not. Although at 4 weeks self-reported adherence levels were, indeed, lower for non-responders, by 12 weeks the trend had been reversed with, more or less, all non-responders claiming to be highly adherent. Clearly, the lack of sufficient fall in HIV RNA levels may not necessarily be related to non-adherence although this is perhaps usually the case. Other reasons can include existence of drug resistance and absorption issues. At any rate, our results do support the need to re-assess the prescribed cART regimen for patients whose MCV levels fail to increase by at least 8% 12 weeks after initiation of therapy particularly as there is also little differentiation in the increase in MCV levels in those reporting full adherence and those not. Once adherence is raised and discussed with the patient, other possible reasons for therapy failure should be explored and the cART regimen modified, if appropriate.
There are a number of other limitations to our study which warrant discussion. Firstly, we have not been able to differentiate between different levels of virological response. Nonetheless, we provide good evidence for the use of MCV to assess whether therapy has, indeed, been initiated and whether the patient is still on it, albeit possibly at less than ideal levels of adherence. We believe that this is still a valuable tool for the attending physician to assess the need for tackling adherence issues with the patient.
Secondly, we may have classified individuals without the necessary decline in HIV RNA as non-responders when they may have been responders. This would have resulted in us under-estimating both sensitivity and specificity however. Conversely, if some of our responders were not adherent, it would be difficult to conceive the reason for the HIV RNA declines they had experienced.
Thirdly, there were no study visits between 4 and 12 weeks of therapy initiation and we are, therefore, unable to assess MCV levels, and likely adherence to therapy in the intervening period. This is unlikely to present as a major problem, however, given that clinical assessment of a patient is unlikely to be scheduled earlier than 12 weeks.
Finally, our trial participants initiated cART at CD4 levels far higher than those at which individuals initiate cART in HIV treatment and care programmes in African countries [23]. Whether changes in MCV levels are equally predictive in differentiating between those who have virologically responded and those who have not, is not known, but needs exploring by the investigators of cohorts with individuals initiating cART at much lower CD4 levels than ours.
It was not our intention to show that MCV can be used in lieu of HIV RNA. Indeed, we have shown that MCV levels do not match the speed of change of HIV RNA with 99 (89%) of participants experiencing a significant drop in their HIV RNA levels by 4 weeks of cART initiation, whilst the rise in MCV at the time was modest. Our study does provide good evidence, however, to support the use of MCV levels to monitor patient adherence, and consequent likely success on therapy, in settings where HIV RNA measurements are too costly or otherwise unavailable.
*APPENDIX: SPARTAC INVESTIGATORS
Trial Steering Committee
Independent Members: A Breckenridge (Chair), P Clayden, C Conlon, F Conradie, J Kaldor*, F Maggiolo, F Ssali
Country Principal Investigators: DA Cooper, P Kaleebu, G Ramjee, M Schechter, G Tambussi, J Weber
Trial Physician
S Fidler
Trial Physician
S Fidler
Trial Statistician
A Babiker
Data and Safety Monitoring Committee (DSMC)
T Peto (Chair), A McLaren (in memoriam), V Beral, G Chene, J Hakim
Co-ordinating Trial Centre
MRC Clinical Trials Unit, London (A Babiker, K Porter, M Thomason, F Ewings, M Gabriel, D Johnson, K Thompson, A Cursley*, K Donegan*, E Fossey*, P Kelleher*, K Lee*, B Murphy*, D Nock*)
Central Immunology Laboratories and Repositories
The Peter Medawar Building for Pathogen Research, University of Oxford, UK (R Phillips, J Frater, L Ohm Laursen*, N Robinson, P Goulder, H Brown)
Central Virology Laboratories and Repositories
Jefferiss Trust Laboratories, Imperial College, London, UK (M McClure, D Bonsall*, O Erlwein*, A Helander*, S Kaye, M Robinson, L Cook*, G Adcock*, P Ahmed*)
Clinical Endpoint Review Committee
N Paton, S Fidler
Investigators and Staff at Participating Sites
Australia: St Vincent’s Hospital, Sydney (A Kelleher), Northside Clinic, Melbourne (R Moore), East Sydney Doctors, Sydney, (R McFarlane), Prahran Market Clinic, Melbourne (N Roth), Taylor Square Private Clinic, Sydney (R Finlayson), The Centre Clinic, Melbourne (B Kiem Tee), Sexual Health Centre, Melbourne (T Read), AIDS Medical Unit, Brisbane (M Kelly), Burwood Rd Practice, Sydney (N Doong) Holdsworth House Medical Practice, Sydney (M Bloch) Aids Research Initiative, Sydney (C Workman)
Coordinating centre in Australia: Kirby Institute University of New South Wales, Sydney (P Grey, DA Cooper, A Kelleher, M Law)
Brazil: Projeto Praça Onze, Hospital Escola São Francisco de Assis, Universidade federal do Rio de Janeiro, Rio de Janeiro (M Schechter, P Gama, M Mercon*, M Barbosa de Souza, C Beppu Yoshida, JR Grangeiro da Silva, A Sampaio Amaral, D Fernandes de Aguiar, M de Fátima Melo, R Quaresma Garrido)
Italy: Ospedale San Raffaele, Milan (G Tambussi, S Nozza, M Pogliaghi, S Chiappetta, L Della Torre, E Gasparotto), Ospedale Lazzaro Spallanzani, Roma (G D’Offizi, C Vlassi, A Corpolongo)
South Africa: Cape Town: Desmond Tutu HIV Centre, Institute of Infectious Diseases, Cape Town (R Wood, J Pitt, C Orrell, F Cilliers, R Croxford, K Middelkoop, LG Bekker, C Heiberg, J Aploon, N Killa, E Fielder, T Buhler)
Johannesburg: The Wits Reproductive Health and HIV Institute, University of Witswatersrand, Hillbrow Health Precinct, Johannesburg (H Rees, F Venter, T Palanee), Contract Laboratory Services, Johannesburg Hospital, Johannesburg (W Stevens, C Ingram, M Majam, M Papathanasopoulos)
Kwazulu-Natal: HIV Prevention Unit, Medical Research Council, Durban (G Ramjee, S Gappoo, J Moodley, A Premrajh, L Zako)
Uganda: MRC/Uganda Virus Research Institute, Entebbe (H Grosskurth, A Kamali, P Kaleebu, U Bahemuka, J Mugisha*, H F Njaj*)
Spain: Hospital Clinic-IDIBAPS, University of Barcelona (JM Miro, M López-Dieguez*, C Manzardo, JA Arnaiz, T Pumarola, M Plana, M Tuset, MC Ligero, MT García, T Gallart, JM Gatell)
UK and Ireland: Royal Sussex County Hospital, Brighton (M Fisher, K Hobbs, N Perry, D Pao, D Maitland, L Heald), St James’s Hospital, Dublin (F Mulcahy, G Courtney, S O’Dea, D Reidy), Regional Infectious Diseases Unit, Western General Hospital and Genitourinary Dept, Royal Infirmary of Edinburgh, Edinburgh (C Leen, G Scott, L Ellis, S Morris, P Simmonds), Chelsea and Westminster Hospital, London (B Gazzard, D Hawkins, C Higgs), Homerton Hospital, London (J Anderson, S Mguni), Mortimer Market Centre, London (I Williams, N De Esteban, P Pellegrino, A Arenas-Pinto, D Cornforth*, J Turner*), North Middlesex Hospital (J Ainsworth, A Waters), Royal Free Hospital, London (M Johnson, S Kinloch, A Carroll, P Byrne, Z Cuthbertson), Barts & the London NHS Trust, London (C Orkin, J Hand, C De Souza), St Mary’s Hospital, London (J Weber, S Fidler, E Hamlyn, E Thomson*, J Fox*, K Legg, S Mullaney*, A Winston, S Wilson, P Ambrose), Birmingham Heartlands Hospital, Birmingham (S Taylor, G Gilleran)
Imperial College Trial Secretariat
S Keeling, A Becker
Imperial College DSMC Secretariat
C Boocock
* Left the study team before the trial ended
Funding
SPARTAC was funded by a grant from the Wellcome Trust (069598/Z/02/Z). Abbott Laboratories generously provided Kaletra/Aluvia (lopinavir and low-dose ritonavir) for the African sites.
ACKNOWLEDGEMENT
Declared none.
CONFLICT OF INTEREST
Declared none.