All published articles of this journal are available on ScienceDirect.

Immune Reconstitution During the First Year of Antiretroviral Therapy of HIV-1-Infected Adults in Rural Burkina Faso
Authors Info & Affiliations
Abstract
There are no data on the outcome of highly active antiretroviral therapy (HAART) in HIV-infected adults in rural Burkina Faso. We therefore assessed CD4+ T-cell counts and HIV-1 plasma viral load (VL), the proportion of naive T-cells (co-expressing CCR7 and CD45RA) and T-cell activation (expression of CD95 or CD38) in 61 previously untreated adult patients from Nouna, Burkina Faso, at baseline and 2 weeks, 1, 3, 6, 9 and 12 months after starting therapy. Median CD4+ T-cell counts increased from 174 (10th-90th percentile: 33-314) cells/µl at baseline to 300 (114- 505) cells/µl after 3 months and 360 (169-562) cells/µl after 12 months of HAART. Median VL decreased from 5.8 (4.6- 6.6) log10 copies/ml at baseline to 1.6 (1.6-2.3) log10 copies/ml after 12 months. Early CD4+ T-cell recovery was accompanied by a reduction of the expression levels of CD95 and CD38 on T-cells. Out of 42 patients with complete virological follow-up under HAART, 19 (45%) achieved concordant good immunological (gain of ≥100 CD4+ T-cells/µl above baseline) and virological (undetectable VL) responses after 12 months of treatment (intention-to-treat analysis). Neither a decreased expression of the T-cell activation markers CD38 and CD95, nor an increase in the percentage of naive T-cells reliably predicted good virological treatment responses in patients with good CD4+ T-cell reconstitution. Repeated measurement of CD4+ T-cell counts during HAART remains the most important parameter for immunologic monitoring. Substitution of repeated VL testing by determination of T-cell activation levels (e.g., CD38 expression on CD8+ T-cells) should be applied with caution.
INTRODUCTION
In the year 2003, the Ministry of Health in Burkina Faso introduced a program for the prevention of mother-to-child transmission of the human immunodeficiency virus (HIV) using voluntary HIV-counseling and testing and single-dose nevirapine in a remote rural area in the north-west of the country. The introduction and subsequent extension of that service was scientifically evaluated in collaboration between the Centre de la Recherche en Santé de Nouna (CRSN) and the University of Heidelberg, Germany. This led to determination of the HIV prevalence in the region to be 3.6% and identified HIV-1 circulating recombinant forms CRF02_AG and CRF06_cpx as predominant HIV strains [1]. Normal values for CD4+ T-cells in healthy adults in Nouna were assessed [2] and a simplified dual platform flow cytometric method for determination of lymphocyte subsets and T-cell maturation phenotypes was evaluated [3]. In that context it was observed that HIV-1-uninfected healthy adult controls living in Nouna had a skewed distribution pattern of CD4+ T-cell maturation phenotypes compared to published data from European adults [4].
When highly active antiretroviral therapy (HAART) was introduced in Burkina Faso with the help of the Global Fund, Nouna was chosen as the first rural site where this treatment was made available. We therefore conducted an observational cohort study of all patients in Nouna starting HAART in 2009 to clarify the following questions: (a) Do HIV-1-infected patients with higher baseline proportions of naive CD4+ T-cells and/or lower levels of T-cell activation show a more rapid or more extensive recovery of CD4+ T-cells under HAART and can these parameters be used as predictors of successful immune recovery? (b) Is the suppression of viral replication by HAART predicted or accompanied by reduced T-cell activation at baseline or during therapy and can these parameters be used as predictors or indicators of successful virologic treatment response?
MATERIAL AND METHODOLOGY
The study was approved by the national ethics committee in Ouagadougou, Burkina Faso and the institutional ethics committee of the University of Heidelberg, Germany and was carried out in compliance with the Helsinki Declaration. Sixty-one treatment-naïve adult patients were recruited at the CRSN from January 2009 and followed until September 2010. All patients signed an informed consent form prior to study entry. Patients were admitted in the study if their CD4+ T-cell counts and/or their clinical status were indicative of the necessity to start HAART [5]. Patients were then seen at 2 weeks and 1, 3, 6, 9 and 12 months after starting HAART. Clinical, immunological, and virological assessments were done at each time point (only CD4+ T-cell counting at week 2 was omitted) using three to five milliliters of K3 -EDTA-anticoagulated peripheral venous blood collected from each patient. Blood samples were transported to the fully climatized laboratory facilities at the CRSN. One specimen was used for immediate CD4+ and CD8+ T-cell counting performed on a FACSCount flow cytometer (BD Biosciences, San Jose, CA). Plasma was obtained from the second specimen by short centrifugation at 3000 rpm, frozen at -40°C and subsequently used for the quantification of viral RNA using the m2000rt RealTime HIV-1 test (the m2000rt test; Abbott, Chicago, IL) at the Centre Hospitalier Universitaire Yalgado Ouedraogo (CHUYO), Ouagadougou, Burkina Faso according to manufacturers’ protocols. The third specimen was used for multiparametric flow cytometry (FCM) on a three-color FACScan flow cytometer (BD Biosciences) using the CellQuest-Pro software (version 5.2). The instrument setting was regularly done using CaliBrite beads (BD Biosciences). Instrument settings were controlled longitudinally and remained constant during the study. A minimum of 10,000 events were analysed in the predefined gate for each analysis.
The distribution of T-cell maturation phenotypes and the expression of activation markers was assessed in peripheral blood T-cells from HIV-1-infected patients and control subjects (n=26) from healthy laboratory and health service personnel in Nouna. Monoclonal antibodies (BD Biosciences) specific for each assay were aliquoted in 3 ml BD FACS tubes and 100 μl anticoagulated venous blood were added. The percentages of CD4+ and CD8+ naïve and memory cell subsets were counted after incubating fresh blood with anti-CD4- or anti-CD8-PerCP, anti-CD45RA-FITC and anti-CCR7–PE-conjugated monoclonal antibodies. Naive CD4+ or CD8+ lymphocytes were identified as CD45RA+CCR7+ cells [3]. T-cell activation was determined with anti-CD95-PE, anti-CD3-PerCP and anti-CD4-FITC (expression of CD95 on CD4+ and CD4neg T-cells) and anti-CD38-PE, anti-CD3-PerCP and anti-CD8-FITC (expression of CD38 on CD8+ and CD8neg T-cells) essentially as described [6, 7] with minor modifications. Both the percentage of marker-positive cells (compared to unstained lymphocytes of each patient) and the median fluorescence intensity (MFI) obtained from FL-2 fluorescence intensity histogram curves of defined subpopulations of cells were assessed. CD38 MFI was measured on CD38+ (instead of total) T-cells in order to focus our analysis on the CD38bright CD8+ T-cell population [8]. The two subpopulations of CD95dim and CD95bright CD4+ T-cells were separately analyzed since we had previously shown that CD95dim cells essentially correspond to the resting/naïve subpopulation of CD4+ T-cells, whereas CD95bright cells are of an activated/memory phenotype [6]. The absolute counts of naive and activated T-cells were calculated in HIV-1-infected patients by multiplying the percent values obtained on the FACScan flow cytometer with absolute CD4+ and CD8+ T-cell counts obtained on the FACSCount flow cytometer.
Unless otherwise indicated, data are given as median values and 10th to 90th percentiles. For mean differences between groups, the 95% confidence interval (CI) is shown. Graphical representations (box-and-whisker as well as dot plots) were used to describe the development of immunological parameters over time. Subjects with an increase of at least 100 CD4+ T-cells/µl above baseline after 12 months of therapy were classified as good immunological responders. Patients with a HIV-1 plasma viral load below detection limit (< 40 copies/ml) were defined as good virological responders [9, 10]. The statistical significance of differences between time points as well as between HIV-1-infected patients and healthy controls or between patient groups stratified according to immunological or virological response to treatment were analyzed using the non-parametric Kruskal-Wallis test with Dunn's correction for multiple comparisons or the Mann-Whitney U-test. Correlations between variables were explored by linear regression analysis using Pearson's correlation coefficients (r) and the coefficients of determination (R2) in patients with complete data sets at baseline, 6 and 12 month of HAART. All calculations were performed using the GraphPad Prism software, version 5.00 (Graph Pad Inc., San Diego, California, USA).
RESULTS
Patients and Treatment
A total of 61 patients were recruited for this study. The cohort mainly consisted of female individuals (72%) with a median age of 35 years (range 30-43 years). CD4+ T-cell counts and HIV-1 plasma viral load levels could be determined at baseline in 61 patients (Fig. 1 and Table 1). The majority of the patients (n=37; 60%) were in the Center for Disease Control (CDC) immunological class C, 23 patients (38%) were in CDC class B and one patient (2%) in CDC class A. Reverse-transcriptase-inhibitor-based HAART was started using d4T/3TC/NVP in 43 patients (70%), AZT/3TC/EFV in 17 patients (28%) and d4T/3TC/EFV in one patient (2%). The numbers of patients seen at each visit and of those lost to follow-up are indicated in Fig. (1). One out of 5 patients who died during the observation period of our study suffered from severe advanced HIV disease (CD4 = 07 cells/µl); this patient died the very same day of inclusion after taking his first dose of HAART. One patient suffering from hepatic malignancy died at the end of week 4. The other deaths - two patients died at the end of week 4 and one patient died after 6 months of HAART - were non-accidental and apparently associated with HIV infection, but the exact causes are not known. Ten plasma samples were not suitable for viral load determination. In addition, the number of patients with complete multiparameter FCM measurements varied at each time point because the necessary monoclonal antibodies were not always available due to logistic delivery problems in Burkina Faso (Table 1).
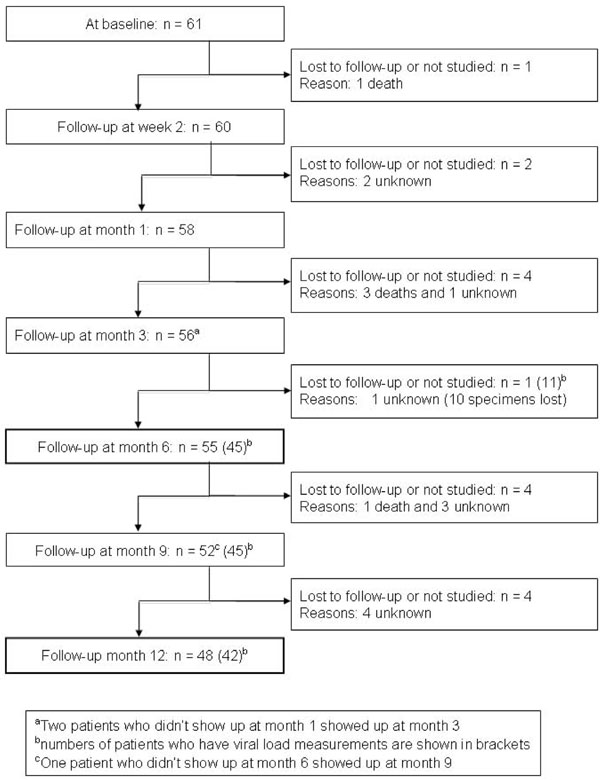
Enrollment and follow-up of HIV-1-infected patients in the study. The number of patients who underwent clinical examination and peripheral blood lymphocyte counting is shown for each time point.
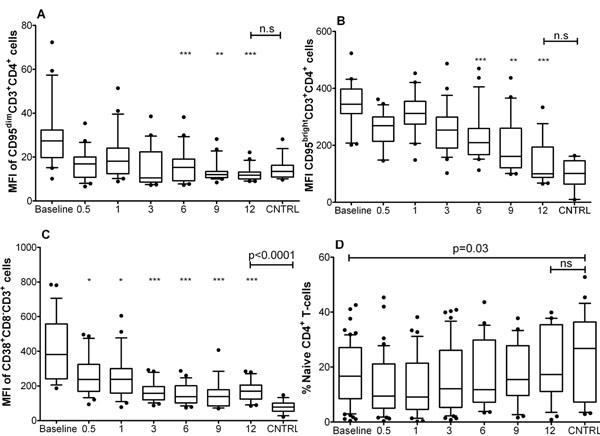
Dynamic of CD4+ T-cell activation and percentage of naive cells. Box plots show the median (horizontal line) and the interquartile range, whiskers indicate the 10th and 90th percentile. The Y-axis shows the median fluorescence intensity (MFI) in arbitrary units or the percentage of naïve CD4+ T-cells; the X-axis denotes months of therapy, baseline = before starting HAART, CNTRL = healthy adult controls from Nouna. The numbers of patients studied at each time point are shown in Table 1. A: Progressive decrease of the MFI of CD95dimCD4+CD3+ cells during treatment. B: Progressive decrease of the MFI of CD95brightCD4+CD3+ cells during treatment. C: Progressive decrease of the MFI of CD38+CD8-CD3+ cells at during treatment. D: Dynamic of the frequency of naive CD4+ T-cells during treatment. The Kruskal-Wallis/Dunn's test was used to compare data at different time points; asterisks indicate statistically significant differences to baseline values (* = p<0.05, ** = p<0.01, *** = p<0.001). The Mann-Whitney U-test was used to compare HIV-1 infected patients at baseline or after 12 months of HAART to healthy controls; comparison bars at the top of the plots indicate the level of statistical significance of these differences.
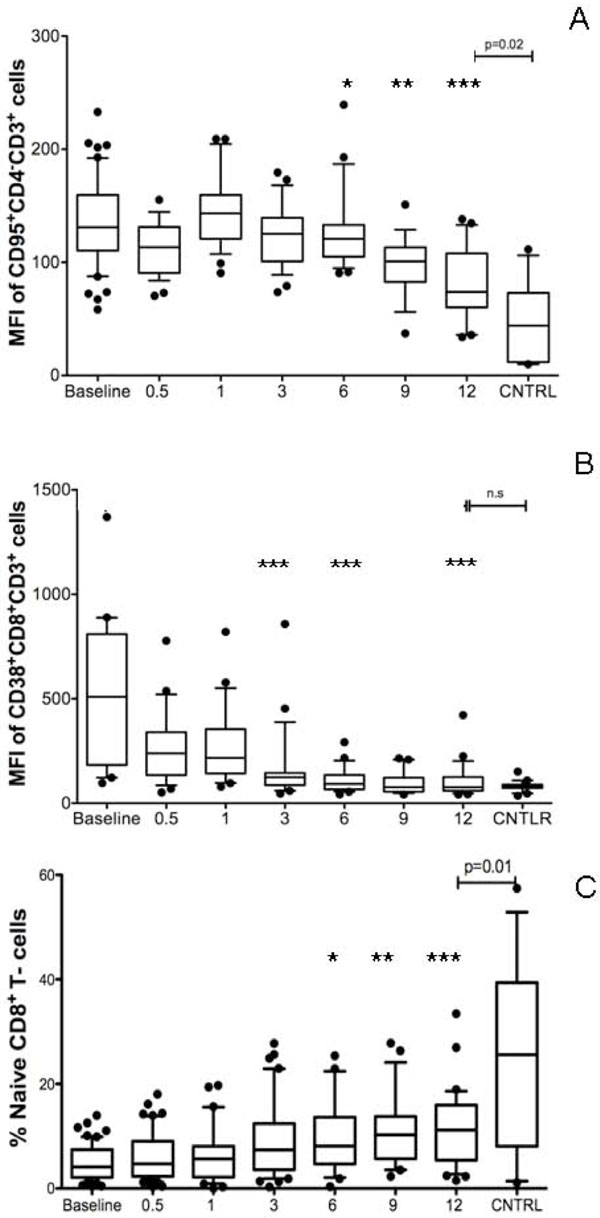
Dynamic of CD8+ T-cell activation and percentage of naive cells. Box plots show the median (horizontal line) and the interquartile range, whiskers indicate the 10th and 90th percentile. The Y-axis shows the median fluorescence intensity (MFI) in arbitrary units or the percentage of naïve CD8+ T-cells; the X-axis denotes months of therapy, baseline = before starting HAART, CNTRL = healthy adult controls from Nouna. The numbers of patients studied at each time point are shown in Table 1. A: Progressive decrease of the MFI of CD95+CD4-CD3+ cells during treatment. B: Progressive decrease of the MFI of CD38+CD8+CD3+ cells during treatment. C: Dynamic of the frequency of naive CD8+ T-cells during treatment. The Kruskal-Wallis/Dunn's test was used to compare data at different time points; asterisks indicate statistically significant differences to baseline values (* = p<0.05, ** = p<0.01, *** = p<0.001). The Mann-Whitney U-test was used to compare HIV-1 infected patients at baseline or after 12 months of HAART to healthy controls; comparison bars at the top of the plots indicate the level of statistical significance of these differences.

Difference of the level of immune reconstitution between groups of patients according to immunologic or virologic response at 12 months of HAART. Dot plots show results obtained in individual patients, the group median is indicatd by a horizontal line. The Y-axis shows the number of cells in the specific CD4+ subpopulation. The X-axis denotes patient groups stratified according to immunological or virological response to treatement (IR=immunologic responders; NIR= immunologic non-responders; VR= Virologic responders; NVR= virologic non-responders. A: Comparison of CD4+ T-cell counts between patient groups. B: Comparison of naïve CD4+ T-cell counts between patient groups. C: Comparison of CD95+CD4+ T-cell counts between patient groups. D: Comparison of CD38+CD8- T-cell counts between patient groups. The Mann-Whitney U-test was used to compare groups; comparison bars at the top of the plots indicate the level of statistical significance of these differences.
Comparison of HAART-Induced Changes on Immunological and Virological Prameters in HIV-1 Patients at Baseline and After 3, 6, 9 and 12 Months of Therapy and HIV-1 Negative Healthy Adult Control Subjects from Nouna. Median Values are Shown with the 10th - 90th Percentile in Parentheses. ND= Not Determined, NA= Not Applicable
| Parameter | At Baseline (A) | At 3 Months (B) | At 6 Months (C ) | At 9 Months (D) | at 12 Months (E) | CNTRL (F) | Kruskal-Wallis Statistic with Dunn's Multiple Comparison Test |
|---|---|---|---|---|---|---|---|
| CD4+ T-cells | |||||||
| n = | 61 | 56 | 55 | 51 | 48 | 26 | ND |
| CD4+ T-cell count (cells/µl) | 174 (33-314) | 300 (114-505) | 353 (128-500) | 330 (150-541) | 360 (169-562) | ND | A<B=C=D=E; p<0.0001 |
| naive CD4+ T-cells | |||||||
| n = | 50 | 42 | 38 | 22 | 36 | 26 | ND |
| CD45RA+ CCR7+ (% of CD4+ T-cells) | 16 (3-36) | 12 (2-37) | 13 (4-33) | 15 (3-33) | 17 (5-37) | 26 (16-43) | A=B=C=D=E<F; p<0.0001 |
| CD45RA+ CCR7+ CD4+ T-cell count (cells/µl) | 23 (2-77) | 20 (4-143) | 40 (8-134) | 56 (6-125) | 67 (8-163) | ND | A=B=C=D=E; p>0.05 |
| activated CD4+ T-cells | |||||||
| n= | 53 | 49 | 41 | 45 | 36 | 26 | ND |
| CD95+ (% of CD4+ T-cells) | 97 (85-100) | 95 (89-99) | 95 (89-99) | 87 (73-98) | 88 (72-98) | 91 (77-98) | A=B=C>D=E=F; p<0.0001 |
| CD95+ CD4+ T-cells (cells/µl) | 173 (37-304) | 281 (109-434) | 281 (73-522) | 247 (91-453) | 298 (118-504) | ND | A<B=C=D=E; p<0.0001 |
| CD38+ (% of CD8neg T-cells) | 91 (81-96) | 83 (71-92) | 78 (73-93) | 75 (66-84) | 76 (67-86) | 59 (34-96) | A>B=C=D=E>F; p<0.0001 |
| CD38+ CD8neg T-cells (cells/µl) | 156 (12 -273) | 223 (97-439) | 258 (68-405) | 259 (109-429) | 292 (95-436) | ND | A<B=C=D=E; p<0.0001 |
| CD8+ T-cells | |||||||
| n = | 61 | 56 | 55 | 47 | 43 | 26 | ND |
| CD8+ T-cell count (cells/µl) | 835 (385-2000) | 931 (405-1695) | 957 (385-1684) | 816 (348-1820) | 905 (423-2000) | ND | A=B=C=D=E; p>0.05 |
| naive CD8+ T-cells | |||||||
| n= | 61 | 56 | 55 | 51 | 48 | 26 | ND |
| CD45RA+ CCR7+ (% of CD8+ T-cells) | 4 (1-9) | 8 (2-25) | 8 (3-20) | 10 (4-24) | 11 (3-18) | 27 (6-37) | A<B=C=D=E<F; p=0.0002 |
| CD45RA+ CCR7+ CD8+ T-cell count (cells/µl) | 19 (2-111) | 66 (16-198) | 72 (18-183) | 72 (20-199) | 90 (22-234) | ND | A<B=C=D=E; p=0.002 |
| activated CD8+ T-cells | |||||||
| n= | 53 | 49 | 41 | 45 | 36 | 26 | ND |
| CD95+ (% of CD4neg T-cells) | 97 (91-100) | 95 (88-99) | 95 (89-99) | 87 (65-95) | 89 (72- 97) | 64 (21-81) | A=B=C>D=E=F; p<0.0001 |
| CD95+ CD4neg T-cells (cells/µl) | 794 (470 -1959) | 819 (444-1633) | 883 (422-1420) | 608 (339-1591) | 785 (340-1773) | ND | A=B=C=D=E; p>0.05 |
| CD38+ (% of CD8+ T-cells) | 98 (90-99) | 92 (81-99) | 88 (71-94) | 85 (68-95) | 85 (63-95) | 83 (63-98) | A>B=C=D=E=F; p<0.0001 |
| CD38+ CD8+ T-cells (cells/µl) | 871 (481-1803) | 843 (429-1447) | 825 (320-1287) | 773 (326-1834) | 695 (396-1783) | ND | A=B=C=D=E; p>0.05 |
| HIV-1 plasma viral load | |||||||
| n = | 61 | 51 | 45 | 45 | 42 | ND | ND |
| log10 copies per ml | 5.8 (4.6-6.6) | 2.1 (1.6-2.8) | 1.6 (1.6-2.4) | 1.6 (1.6-2.1) | 1.6 (1.6-2.3) | NA | A>B=C=D=E; p<0.0001 |
Putting Research Findings on the Dynamics of Naive T-Cells Coexpressing CD45RA and CCR7 and the T-Cell Activation Markers CD95 and CD38 in HIV- 1-Infected Africans During the First Year of Highly Active Antiretroviral Therapy (HAART) into the Context of Previously Published Evidence
What is Already
Known on this Topic:
|
What this Study Adds:
|
Seven patients reported a bad drug adherence for several days: one patient stopped HAART for 4 days at 2 weeks of therapy, two for 7 and 28 days at month 1, three patients stopped for 5, 7 and 10 days at month 3, and one patient had several treatment interruptions. The unique self-declared reason for bad drug adherence was the occurrence of unwanted side effects of therapy such as fatigue, abdominal pain, diarrhea and vomiting. In the first month of HAART, all patients showed a statistically significant mean increase in CD4+ T-cell counts by 160±97 cells/µl (95% CI: 160-214 cells/µl; p<0.0001) and experienced a drop in HIV-1 plasma viral load (VL) of more than 2.0 log10 copies per ml. After three months of treatment, median VL was significantly lower and CD4+ T-cell counts were significantly higher than at baseline before starting HAART (Table 1).
Immunological Follow-Up
This early treatment response was accompanied by a significant reduction in the percentage of activated T-cells in the peripheral blood (%CD95+ CD4+, %CD38+ CD8+, and %CD38+ CD8neg T-cells), while absolute counts of these cells increased (Table 1). A more detailed analysis of treatment-induced changes in T-cell activation and maturation of circulating CD4+ T-cells over time revealed an immediate significant reduction in CD38 median fluorescence intensity (MFI) and a gradual decrease in CD95 MFI. These changes reached statistical significance as compared to baseline levels after 6 months of therapy (Fig. 2A-C). The percentage of naive CD4+ T-cells showed a slight but non-significant trend towards lower values in the first month of treatment (Fig. 2D). In the CD8+ T-cell compartment, a steep reduction in CD38 MFI was seen as early as 2 weeks after starting HAART (reaching statistical significance as compared to baseline levels after 3 months of therapy). In contrast, the gradual decrease in CD95 MFI and the concomitant increase in the percentage of naive CD8+ T-cells reached statistical significance as compared to baseline only after 6 months of therapy (Fig. 3).
From month 3 to month 12 of HAART, activation levels of CD4+ and CD8+ T-cells further consolidated with CD95 and CD38 MFI showing reduced inter-subject variation. At 12 months of therapy the MFI-values were significantly lower when compared to baseline levels on all T-cell subpopulations investigated (Figs. 2A-C,3A, B). The percentage of naive CD4+ T-cells returned to pre-treatment values (Fig. 2D), while the percentage of naive CD8+ T-cells did not increase beyond the level reached after 6 months of therapy (Table 1 and Fig. 3C). There was no correlation between CD4+ T-cells or HIV-1 plasma viral load and the extent of activation decay after starting the treatment (data not shown). Only the absolute number of naïve T-cells at 12 months of treatment was significantly correlated with the CD4+ T-cell count at baseline (r=0.591, R2=0.396, p=0.0003) and the CD4+ T-cell increase at 12 months of therapy (r=0.488; R2=0.238; p=0.002).
As shown in Table 1, statistically significant differences were observed after 12 months of HAART between patients and healthy controls for the percentage of naive CD4+ and CD8+ T-cells (patients < controls), the percentage of CD38+ CD8neg T-cells and the CD38 MFI on these cells (Fig. 2C) and the CD95 MFI on CD4neg T-cells (Fig. 3A) (patients > controls). The expression of CD95 on CD4+ T-cells and of CD38 on CD8+ T-cells was not significantly different between patients at 12 months of therapy and healthy controls. Absolute CD4+ T-cell counts at 12 months of HAART were highly correlated with the respective baseline values (r=0.754, R2=0.568; p<0.0001). The absolute increase in CD4+ T-cells after 3 months of HAART however was only marginally predictive of CD4+ T-cell counts at 12 months of therapy (r=0.367, R2=0.134; p<0.016). The relative increase of CD4+ T-cells over baseline values was highest in those patients who showed the lowest CD4+ T-cell counts before starting treatment (r=-0.631, R2=0.40; p<0.0001). No other association between immunovirological parameters at baseline or during the first month of therapy and the increase in CD4+ T-cell counts after 12 months of HAART was seen.
Immunological and Virological Treatment Response after 12 Months of HAART
Out of 48 patients with complete immunologic follow-up, 33 (69%) had a sustained increase in CD4+ T-cell counts of at least 100 cells per µl above baseline (classified as good immunologic response [IR]). In an intention-to-treat analysis (i.e., counting all patients lost to follow-up as treatment failure), the rate of good IR was 54% (33 out of 61 patients). Before starting HAART, patients with good IR had a slightly higher median plasma viral load level than patients without good IR; no other statistically significant baseline differences between both groups were seen (Supplementary Table 1). After 12 months of therapy, patients with good IR had significantly higher CD4+ T-cell counts (together with higher absolute counts of CD45RA+CCR7+ CD4+, CD95+ CD4+, and CD38+ CD8neg T-cells) and slightly higher absolute numbers of naive CD8+ lymphocytes (Fig. 4A-D and Supplementary Table 2). Out of 42 patients with complete immunologic and virologic follow-up at 12 months of HAART, 33 (79%) had good IR and 25 (60%) good virologic response (VR; defined as a sustained suppression of HIV-1 plasma viral load below the detection limit of 40 RNA-copies per ml). At baseline, patients with good VR had a slightly but significantly lower median CD95 MFI on CD95bright CD4+ T-cells and a lower median CD38 MFI on CD8+ T-cells as compared to virologic non-responders (Supplementary Table 1). After 12 months of therapy no statistically significant differences between both groups were seen - except for the fact that good virologic responders by definition had an undetectable HIV-1 viral load (Supplementary Table 2).
Predictors and Indicators of Immunological and Virological Treatment Response
There was a considerable rate of discordant responses to HAART after 12 months of therapy. Only 19 out of 42 patients (45%) showed good IR and VR, 14 (33%) showed good IR but not good VR, 6 (14%) showed good VR but not good IR, and 3 patients (7%) had neither good IR nor VR (Supplementary Table 3). At baseline, patients with a discordant treatment response (good IR but not good VR) - when compared to patients with a concordant good response - had significantly higher CD38 MFI values on circulating T-cells [arbitrary units; median (10th to 90th percentile): 509 (154-886) vs 217 (123-1125) on CD38+ CD8+ T-cells, p<0.01; 482 (221-738) vs 292 (192-749) on CD38+ CD8neg T-cells, p<0.001]. Also the percentage of CD95+CD4+ T-cells was slightly but significantly higher 99 (93-100)% vs 97 (83-99)%, p<0.01] (Supplementary Table 3). After 12 months of HAART, only the percentage of naive CD8+ T-cells indicated a statistically significant difference between these two groups, being nearly twice as high in patients with concordant good response to therapy [16 (2-0025;] as compared to patients with discordant treatment response 8 (2-17)%, p<0.01 (Supplementary Table 3). A lack of IR after 12 months of HAART was present in 6 out of 25 patients with good VR. Despite significantly lower CD4+ T-cell counts no differences were seen in the expression of T-cell activation markers or in the percentage of naive T-cells when compared to patients with concordant good IR and VR. We also examined the predictive value of several indicators of T-cell activation and maturation at baseline and during treatment. Despite significant differences between virologic responders and non-responders and despite significant correlations of these markers with plasma VL levels at baseline (data not shown), the expression patterns of CD95 or of CD38 on T-cell subsets in the peripheral blood could not reliably indicate or predict the presence or absence of effective suppression of viral replication (see Supplementary Fig. 1).
DISCUSSION
In our study we show that even under the environmental conditions in rural Burkina Faso CD4+ T-cell reconstitution following HAART is a biphasic phenomenon. It is characterized by a first phase mainly constituted of memory cells and a second phase during which naive T-cells progressively appear in the peripheral blood [11, 12]. CD4+ T-cell reconstitution after 12 months of therapy was similar to the observations from the CIPRA-SA cohort in South Africa, for which an increase from a mean (± standard error of the mean) of 186±8 cells/µl at baseline to 334±18 cells/µl at month 12 was reported [13]. The absolute rise in CD4+ T-cell counts after 12 months of HAART was mainly determined by the baseline CD4+ T-cell counts in our patients. More immunological benefit can be expected when therapy is started at higher CD4+ T-cell counts than actually practiced in Nouna [14]. Interestingly, not a single patient showed signs or symptoms of HAART-induced immune reconstitution inflammatory syndrome, a potential severe side-effect of successful T-cell regeneration in patients with advanced HIV-disease [15].
Over the entire year of treatment, a slight but continuous increase in the percentage of naive CD8+ T-cells was seen until month 6 of therapy. At the same time, the percentage of naive CD4+ T-cells reached pre-treatment levels again, and expression of the CD95 receptor was significantly reduced as compared to baseline. Regeneration of both naive CD4+ and CD8+ T-cells indicates that repetitive exposure to tropical infectious and non-infectious agents does not disturb the process of T-cell reconstitution under HAART in West African patients. After 12 months of HAART, however, HIV-1-infected patients in Nouna still had a significantly lower percentage of circulating naive CD8+ T-cells than healthy adult controls. A comparison with the reference values for naive T-cells in our study area [3] revealed lower absolute numbers of naive CD4+ T-cells after 12 months of HAART than in healthy controls (mean±standard deviation: 228±146 cells per µl; 5th to 95th percentile: 35 to 496 cells per µl). Absolute numbers of naive CD8+ T-cells after 12 months of HAART were also below the values observed in healthy adults (mean±standard deviation: 173±103 cells per µl; 5th to 95th percentile: 36 to 363 cells per µl).
Early immunologic treatment response was accompanied by a significant reduction in the percentage of activated T-cells in the peripheral blood, while absolute counts of these cells increased. A similar rapid decrease in the activation levels of peripheral blood T-cells has been described in European cohorts [18-20] and in studies on HIV-1-infected Africans receiving antiretroviral therapy [7, 13, 21]. This decrease may thus be explained by a causal association between high levels of HIV-1 replication leading to T-cell activation, followed by an acceleration in the proliferation rate of naive T-cells. The slow increase in naive T-cells during HAART may depend on thymopoiesis and on homeostatic autoproliferation of postthymic T-cells in the periphery when filling empty spaces in a lymphopenic host. Without additional measurements (e.g., quantification of the fraction of Ki-67+ proliferating naive T-cells or of T-cell receptor rearrangement excision cycles) it is not possible to discern the relative contribution of these regeneration pathways [16]. According to Di Mascio et al. [17], HAART-induced changes in naive T-cell dynamics cannot be explained by changes in thymic output but rather depend on a treatment-induced reduction in proliferation rates of naive T-cells. These cells may be lost at a lower rate into the activated/memory compartment once the HIV-1-induced chronic hyperactivation is reduced by effective HAART. Naive T-cells may then participate in homeostatic autoproliferation leading to the late increase in resting naive T-cells observed in the Nouna patient cohort.
Analysis of the development of expression patterns of CD95 on peripheral blood T-cells supports this interpretation. We [6, 22] and others [23] had shown in the past that the cell populations constituting the CD95dim and the CD95bright peak of CD4+ T-cells correspond to resting naïve and activated memory cells, respectively. In HIV-infected individuals, the slow and continuous change in the density of CD95 receptors on these cells seems to be more closely connected to the slow increase in the percentage of CD45RA+CCR7+ cells than to the rapid decrease in expression of the CD38 receptor. After 12 months of HAART, however, HIV-1-infected patients in Nouna still had a slightly higher expression of CD95 on CD4neg (i.e., CD8+) T-cells than healthy adult controls. The percentage of naive CD8+ T-cells was reduced in HIV-1-infected patients, and the expression of CD38 on CD8+ T-cells was not significantly different from the controls. Skewed maturation and increased activation of peripheral blood T-cells in HIV-1-infected patients after 12 months of HAART compared to healthy controls may therefore be explained by several factors: (1) Previous HIV-induced T-cell loss may not be fully compensated by thymic reconstitution and autoproliferation of naive T-cells after 12 months of HAART. This may lead to homeostatic expansion of these cells in the periphery causing increased expression of CD95 or CD38 on circulating naive T-cells as a sign of cellular cycling. (2) In response to environmental stimuli circulating naive T-cells may become constitutively activated. We had observed high prevalences of, e.g., CMV and HBV in the study area [24]. T-cell responses to viral infection would be expected to increase CD38 expression in the CD8+ T-cell compartment [25]. However, after 12 months of HAART, HIV-1-infected patients in Nouna showed a similar expression of CD38 on CD8+ T-cells as healthy controls. Differences in the exposure to other viral infections than HIV is thus an unlikely cause of the deviations observed in the CD4+ and CD8+ T-cell compartments in these individuals. (3) The residual viral replication - which was seen in 17 patients without good virological response (NVR) - may also act as a continuous T-cell stimulus. However, continuing HIV-replication would also be expected to increase primarily the expression of CD38 on CD8+ T-cells [7].
These results point to a common problem in flow cytometric analysis of T-cell activation markers in HIV-infected individuals. In the individual patient with rising CD4+ T-cell counts under HAART, an increase in CD38 expression on CD8+ T-cells most probably indicates a rise in viral load (see supplementary material). In the lymphopenic patient with advanced disease and continuously low CD4+ T-cell counts (<50 cells µl-1) despite HAART, the effects of cell cycling due to homeostatic autoproliferation may be the main determinants of the expression levels of molecular markers of T-cell activation. It is therefore not surprising that we were not able to predict a good virological treatment response by measuring T-cell activation - despite the statistically significant correlations between these parameters. While the predictive value of CD38 expression on CD8+ peripheral blood T-cells for virological treatment failure has been demonstrated in patient cohorts in South Africa [13] and Thailand [26], findings similar to ours were reported by Ondoa and colleagues in patients from Abidjan, Côte d'Ivoire [7]. Despite appearing to be a sensitive detector of HIV-1 plasma viral load, the percentage of CD38+ CD8+ T-cells lacks specificity if used as a screening test for the sensitive detection of early virological failure. Even the use of CD38 median fluorescence intensity did not improve the capacity of the test to discriminate treatment success and treatment failure (see also Supplementary Fig. 1). Assessment of CD38 expression on CD8+ T-cells may be more relevant if it were restricted to the memory (CD45RO+) subpopulation of CD8+ T cells [27] or if the percentage of CD8+ CD38bright T cells (defined as having >8,500 CD38 binding sites per cell) were measured [8]. However, the observation that assessment of longitudinal changes of these parameters in the individual patient under HAART may indicate changes of plasma viral load levels [13] is corroborated by similar observations in single patients of our West African patient cohort (see Supplementary Table 4).
CONCLUSION
Repeated assessment of CD4+ T-cell counts remains the most important measure of immunological follow-up of HIV-infected patients before and during HAART. The expression of the T-cell activation markers CD95 and CD38 may be an indicator of the overall immune recovery in patients with advanced disease receiving HAART. T-cell activation markers should be used with caution as a substitute for repetitive measurements of HIV-1 plasma viral load in order to assess the virologic response to treatment.
CONFLICT OF INTEREST
The authors declare that they have no conflict of interest.
ACKNOWLEDGEMENTS
We are grateful to the laboratory technicians at the Centre de Recherche en Santé de Nouna (CRSN), Burkina Faso. This study was supported by a grant from the Deutsche Forschungsgemeinschaft (SFB 544, project A6) and by stipends from the Deutscher Akademischer Austauschdienst.
SUPPLEMENTARY MATERIAL
Supplementary Fig. ( 1). Receiver operating characteristics (ROC) curves of median fluorescence intensity of activation markers on peripheral blood T-cells show the lack of usefulness of these parameters as indicators of poor virologic treatment reponse at 12 months of HAART. ROC curves were generated using the MS Excel template of Marley W. Watkins available at http://www.public.asu.edu/~mwwatkin/Software/ROCanalysis.xls. Abbreviation: AUC = area under the ROC curve.
Supplementary Table 1. Immunological and virological parameters in HIV-1 infected subjects at baseline, i.e., before starting HAART. Median values are shown with their 10th - 90th centile in parentheses. Patients with complete immunological follow-up (n=48) were grouped according to response to treatment: IR = good immunologic response, NIR = immunologic non-response. Patients with complete virologic follow-up (n=42) were divided into the following groups: VR = good virologic response, NVR = virologic non-response. The Mann-Whitney U-test was used to compare the IR vs NIR and VR vs NVR groups, respectively.
Supplementary Table 2. Immunological and virological parameters in HIV-1 infected subjects after 12 months of HAART. Median values are shown with their 10th - 90th centile in parentheses. Patients with complete immunological follow-up (n=48) were grouped according to response to treatment: IR = good immunologic response, NIR = immunologic non-response. Patients with complete virologic follow-up (n=42) were divided into the following groups: VR = good virologic response, NVR = virologic non-response. The Mann-Whitney U-test was used to compare the IR vs NIR and VR vs NVR groups, respectively.
Supplementary Table 3. Immunological and virological parameters in HIV-1 infected subjects at baseline and after 12 months of HAART. Median values are shown with their 10th - 90th centile in parentheses. Patients (n=42) are grouped according to response to treatment (IR = good immunologic response, VR = good virologic response, NIR = immunologic non-response, NVR = virologic non-response); the Mann-Whitney U-test was used to compare the IR and VR vs IR but NVR group.
Supplementary Table 4. Analysis of individual treatment responses to HAART in patients with virological treatment failure during 12 months of HAART. Longitudinal data from 5 patients with CD4 counts ranging from 7 to 231 cells µl-1 at baseline are shown. Abbreviations: M= months of treatment; MFI = median fluorescence intensity; ND = not determined; VL= viral load (log10 copies/ml).