All published articles of this journal are available on ScienceDirect.

Testosterone Deficiency and Changes in Body Composition in Men Living with HIV
Authors Info & Affiliations
Abstract
Introduction
Testosterone Deficiency (TD) is a frequent but often overlooked comorbidity among men living with HIV (MLWHIV). This study compared TD frequency using Total Testosterone (TT) and calculated Free Testosterone (cFT) and factors potentially associated with this condition.
Methods
This observational cross-sectional study included MLWHIV > 18 years receiving Antiretroviral Therapy (ART). Clinical and laboratory data were collected. Bone Mass (BM), Lean Mass (LM), and Fat Mass (FM) were assessed using Dual-energy X-ray Absorptiometry (DXA). TD was defined as Total Testosterone (TT) < 300 ng/dL and/or calculated Free Testosterone (cFT) < 6.4 ng/dL.
Results
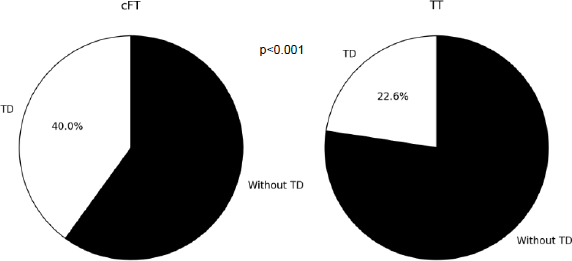
Eighty-four participants were included from May 2014 to August 2015. TD prevalence was 22.6% by TT and 44% by cFT (p < 0.001). Participants with TD were older (50 vs. 45 years, p < 0.01), had a higher prevalence of metabolic syndrome (27% vs. 4.3%, p < 0.01), increased waist circumference (21.6% vs. 4.3%, p < 0.05), and a lower frequency of normal BM (37.5% vs. 67.5%, p < 0.05).
Discussion
TD was more frequent used with cFT criteria and was associated with older age, metabolic syndrome, abdominal obesity, and lower bone mass. No correlation was found with CD4 count or ART exposure, likely reflecting a virologically suppressed and homogeneous cohort. The single-center, cross-sectional design limits causal inference and external generalizability.
Conclusion
In MLWHIV, the cFT criterion identified more cases of TD than TT alone. TD is associated with low bone mass, increased waist circumference, and a higher prevalence of metabolic syndrome, highlighting the importance of systematic evaluation using cFT. Longitudinal studies are needed to clarify causal pathways and guide management.
1. INTRODUCTION
The effectiveness of Antiretroviral Therapy (ART) has prolonged the disease-free life of people living with the Human Immunodeficiency Virus (HIV). On the other hand, HIV treated with ART is associated with a series of comorbidities unrelated to Acquired Immunodeficiency Syndrome (AIDS), characterizing the HIV infection as a chronic condition [1, 2].
Low testosterone levels are commonly seen in men living with HIV (MLWHIV). It is associated with higher mortality, frailty, osteoporosis, worse quality of life, and sexual performance [3, 4]. The prevalence depends on the population studied and the diagnostic criteria used, varying from 3 to 60% in the post-ART era [4].
Testosterone circulates in plasma in free (unbound) and protein-bound form. Only 1-4% is found in free form, while the majority is bound to albumin and Sex Hormone Binding Globulin (SHBG) [5]. HIV infection is associated with an increase in SHBG levels, which leads to normal levels of total testosterone and low levels of the free form [6]. The Endocrine Society recommends the calculation of Free Testosterone (cFT) or direct measurement using a balance dialysis assay for laboratory diagnosis of hypogonadism in MLWHIV. Measurements using immunoassays are not recommended as they are less accurate [6].
Testosterone Deficiency (TD) screening in MLWHIV is recommended by the Infectious Diseases Society of America (IDSA) in the presence of reduced libido, erectile dysfunction, reduced bone mass, or fragility fracture. The Endocrine Society also includes cases of weight loss [6, 7].
The pathophysiology of low testosterone levels in this population is multifactorial, and there is controversy regarding the associated predictive factors [8, 9]. Clinical factors such as age, body mass index, waist circumference, metabolic syndrome, smoking, diabetes, duration of illness, and duration of ART appear to be associated with an increased risk of testosterone deficiency [4].
This study aimed to evaluate the frequency of TD in MLWHIV, the factors, and changes in body composition potentially associated with this condition.
2. MATERIALS AND METHODS
2.1. Study Design and Participants
2.1.1. Inclusion and Exclusion Criteria
This observational cross-sectional study included MLWHIV aged over 18 years, recruited from the Infectious Diseases Outpatient Clinic of a tertiary care university hospital in the metropolitan region of Rio de Janeiro, Brazil. Participants were selected through convenience sampling. The exclusion criteria included previous use of anabolic steroids, androgenic agents, psychotropic drugs, opioids, or other substances that interfere with gonadal function, the presence of severe chronic or acute illness, endocrinopathies such as pituitary, thyroid, gonadal, or adrenal diseases, chronic kidney disease with a glomerular filtration rate below 60 mL/min/1.73 m2 according to CKD-EPI, and any changes in the ART regimen within the last six weeks [10].
The study was approved by the Research Ethics Committee of the University Hospital CAAE 17322613.9.0000.5243 and all participants signed an informed consent form before entering the study.
2.1.2. Clinical Assessment
Clinical data (gender, age, smoking, and alcohol consumption, duration of ART and HIV diagnosis) and anthropometric data (weight, height, cervical and abdominal circumference) were collected. The clinical assessment was carried out by the same examiner. Body weight was measured using a Filizola anthropometric scale (São Paulo, SP, Brazil) calibrated by the Brazilian National Metrology Institute. Height was assessed using a stadiometer, with the patient standing upright, arms extended along the body, head raised, and looking at a fixed point at eye level, with feet together and legs forming a right angle. Waist Circumference (WC) was measured with an inelastic SANNY measuring tape (São Bernardo do Campo, SP, Brazil), at the midpoint between the iliac crests and the last ribs, with the patient in an upright position at the end of the expiratory respiratory movement [11]. Neck Circumference (NC) was measured in the middle of the neck, immediately below the laryngeal prominence, with the participant in an upright position, looking forward, and with shoulders down. Body Mass Index (BMI) was calculated by dividing the weight, expressed in kilograms, by the square of the height in meters (kg/m2). Participants were classified according to Body Mass Index (BMI) as underweight, eutrophic, overweight, and obese [12]. The waist-to-height ratio (WHtR) was calculated by dividing the waist by height, with a cutoff point of 0.50 [13]. WC ≥ 102 cm was considered increased and Metabolic Syndrome (MS) was defined by the NCEP ATPIII (National Cholesterol Education Program Adult Treatment Panel III) diagnostic criteria and included 3 of the following 5 criteria: WC ≥ 102 cm in men, triglycerides ≥ 150 mg/dl or specific treatment, HDL-cholesterol < 40 mg/dl, Systolic Blood Pressure (SBP) ≥ 130 mmHg or Diastolic Blood Pressure (DBP)≥ 85 mmHg or treatment with antihypertensives, and fasting blood glucose ≥ 100 mg/dL or taking medication for glycemic control [14]. Diabetes Mellitus (DM) was defined according to the American Diabetes Association (ADA, 2024) criteria, as two fasting blood glucose levels ≥ 126 mg/dL or an HbA1c level≥ 6.5%, or the use of medication for glycemic control. Hypovitaminosis D was defined as 25-OH vitamin D TOTAL (25 (OH)D3) levels <30 ng/dL, as recommended in patients using ART [15].
2.1.3. Laboratory Assessment
Blood samples were collected in the morning after an overnight fast. Total testosterone and SHBG were measured using the Immulite 2000 Kit (Siemens). The reference values for SHBG are 10.0 to 57.0 nmol/L, and for Total Testosterone (TT), they are 129 to 767 ng/dL. Free testosterone was calculated according to Vermeulen's formula available at https://www.issam.ch/freetes to.htm [16].
The diagnosis of TD was verified by two criteria: serum TT levels < 300 ng/dL and/or cFT < 6.4 ng/dL (64 pg/mL) [6].
The 25(OH)D3 was measured using the LIAISON® 25 OH vitamin D TOTAL assay using the chemiluminescent immunoassay technology. Total Cholesterol, Triglyceride, HDL, and Glycemia were evaluated using an automated enzymatic/colorimetric method. LDL was calculated using the Friedewald equation (Total Cholesterol Col - (Triglycerides / 5) – HDL). Creatinine was assessed using the modified Jaffé kinetic method.
2.1.3.1. Assessment of Body Composition using the Dual-energy X-ray Absorptiometry (DXA) Technique
Whole-body DXA was performed using the Lunar iDXA model – General Electric Healthcare, Madison, WI (Encore 2010 software – version 13.40). DXA was performed in the supine position, with standard limb positioning, and the subject was fasting for at least 2 hours.
2.1.3.2. Bone Mass
Bone Mineral Density (BMD), in g/cm2, was measured in the Total Femur (TF), Femoral Neck (FN), lumbar spine (L1–L4), and forearm [distal radius third (radius 33%) and Ultradistal Radius (UD)]. For individuals aged ≥ 50 years, BMD was assessed using T-scores at thresholds: T-score ≥ −1.0 for normal BMD, T-score ≤ −1.1 and > −2.5 for osteopenia, and T-score ≤ -2.5 for osteoporosis. For men aged < 50 years, age-adjusted Z-scores were calculated, with a Z-score ≤ − 2.0 being considered low bone mass for age, as recommended by the World Health Organization (WHO) and the International Society of Clinical Densitometry (ISCD) [17, 18].
2.1.3.3. Lean Mass
Lean Mass Was Assessed Using The Appendicular lean mass index (ALM), which is the sum of the lean mass of the upper and lower limbs. Low lean mass was defined using the criteria established by Baumgartner and the Foundation for the National Institutes of Health (FNIH). The first is the relationship between the ALM and the square of the height in meters. Results < 7.26 kg/m2 in men define low lean mass [19]. The second is the relationship between ALM and BMI, with low lean mass being defined as a value < 0.789 in men [20].
2.1.3.4. Fat Mass
Fat mass was assessed using the Fat Mass Index (FMI), Fat Mass Ratio (FMR), and Android Gynoid ratio (A/G). FMI is the relationship between total body fat in kilograms and the square of height in meters [21]. Values greater than 6 kg/m2 were considered high [22]. The FMR is the ratio between the percentage of fat mass in the trunk and the percentage of fat mass in the lower limbs [23]. The A/G ratio is the relationship between body fat in the android region (located between the ribs and the pelvis, with a demarcation greater than 20% of the distance between the iliac crest and the neck and a lower demarcation at the top of the pelvis) and the body fat of the gynoid region (area located between the hips and the upper thighs, with an upper demarcation below the top of the iliac crest at a distance of 1.5 times that of the android height). Values ≥ 1 were considered increased [22].
2.1.3.5. Lipodystrophy
Lipodystrophy was defined as the presence of Lipohypertrophy (LH) and/or Lipoatrophy (LA). LH was defined as the presence of increased WC (≥ 102 cm) and increased WHtR (≥ 0.5). LA was defined by the relationship between the percentage of leg fat and BMI < 0.65 [23, 24].
2.1.3.6. Statistical Analysis
Statistical analysis was performed using the statistical software R version 3.3.2 for Windows. Continuous variables are presented as medians and Interquartile Ranges (IQRs). Categorical variables are presented as absolute frequencies (n) and percentages (%). Data were subjected to the student’s t-test and ANOVA (for normal distribution) or the Mann-Whitney or Kruskal-Wallis test (for non-parametric data) according to the sample characteristics. The Pearson or Spearman correlation was used for continuous variables. The chi-square test (χ2) or Fisher's exact test was used for categorical variables. A p-value of less than 0.05 was considered statistically significant.
3. RESULTS
In total, 84 MLWHIV were included from May 2014 to August 2015, all of them were on ART for at least two years. Median age was 47 (40-52) years. The time of HIV diagnosis was 12 (8-17) years, and the duration of ART was 10 (6-15.5) years. Considering the class of antiretrovirals: 98.7% were using nucleoside analogue reverse transcriptase inhibitors (NRTI), 65% were using non-nucleoside analogue reverse transcriptase inhibitors (NNRTI), 49,3% were using protease inhibitors, and a few (7,5%) were on integrase inhibitors. All of them had an undetectable viral load. The CD4 count was 582 (411-769) cells/mm3 and the CD4 nadir was 113.5 (37.8-249.3) cells/mm3 (1).
The median TT levels were 396.5 (314.8-490.2) ng/dL, SHBG 45.4 (35.0-60.2) nmol/L, and cFT 6.6 (5.3- 7.4) ng/dL. Considering only the TT value, the TD frequency was 19 (22.6%), and when calculating the FT, the DT frequency increased to 37 (44%).
The majority (54.8%) of participants were eutrophic, and 10 (12%) had increased WC. DM occurred in 4 participants (4.8%), MS in 12 (14.3%), and hypovitaminosis D in 66 participants (79.5%).
A total of 72 participants were evaluated by DXA, and changes in Bone Mineral density (BM) occurred in 33 participants: 9.7% had osteoporosis, 30.5% had osteopenia, and 5.5% had low bone mineral density for their age. The frequency of low LM was 27.7% using the Baumgartner criterion and 5% using the FNIH criterion. Lipodystrophy was observed in 45 participants (53.6%). The frequency of increased FMI was 38.6%, and the frequency of increased A/G was 81.4% (Table 2).
| - | All (84) | With TD (37) | Without TD (47) | p-value |
|---|---|---|---|---|
| Age (years) (Median IQ:25-75) | 47.0 (40.0-52.0) | 50 (46.0-57.0) | 45 (38.0-50.0) | 0.005 |
| Smoking (%) | 21 (25.0) | 10 (27.03) | 11 (23.4) | 0.890 |
| Alcoholism (%) | 4 (5.0) | 1 (2.7) | 3 (6.5) | 0.620 |
| HIV data (Median IQ:25-75) | - | - | - | - |
| Time of ART (years) | 10 (6.0-15.5) | 11 (8.0-16.0) | 9.5 (6.0-15.0) | 0.532 |
| Time of HIV diagnosis (years) | 12 (8.0-17) | 11 (10.0-17.0) | 12.5 (8.0-16.0) | 0.840 |
| Viral load copies (copies/mm3) | 0 (0-0) | 0 (0-0) | 0 (0-0) | 0.519 |
| CD4 count (cells/mm3) | 582 (411.0-769.0) | 645.5(437.5-777.8) | 508 (390.0-749.0) | 0.245 |
| CD4 nadir | 113.5 (37.8-249.3) | 105 (43.0-229.0) | 116 (31.0-259.0) | 0.930 |
| Antiretroviral therapy (ART) % | - | - | - | - |
| Protease inhibitor | 39 (49.3) | 16 (43.2) | 23 (54.0) | 0.490 |
| Nucleoside analogue reverse transcriptase inhibitors | 78 (98.7) | 37 (100.0) | 41 (95.0) | 0.490 |
| Integrase inhibitor | 6 (7.5) | 2 (5.4) | 4 (9.4) | 0.689 |
| Non-nucleoside analogue reverse transcriptase inhibitors. | 51 (65.0) | 25 (70.3) | 26 (60.5) | 0.674 |
| Anthropometric data | - | - | - | - |
| Weight (kg) (Median IQ:25-75) | 72.9 (64.4-82.0) | 75.40 (66.0-86.3) | 71.8 (64.3-80.9) | 0.297 |
| Body mass index (kg/m2) (Median IQ:25-75) |
24.3 (22.4-26.2) | 24.9 (21.9-28.3) | 23.91 (22.5-26.4) | 0.488 |
| Waist circumference (cm) (Median IQ:25-75) |
90.8 (84.0-97.5) | 92 (84.0-102.0) | 88.5 (84.3-94.8) | 0.070 |
| Neck circumference (cm) (Median IQ:25-75) |
38 (36.3-40.0) | 38 (37.0-40.0) | 38 (36.1-40.0) | 0.199 |
| Increased WC (%) | 10 (12.0) | 8 (21.6) | 2 (4.3) | 0.016 |
| Increased WHtR | 60 (71.4) | 28 (76.0) | 32 (70.0) | 0.710 |
| Nutritional status (%) | - | - | - | - |
| Eutrophic | 46 (54.8) | 19 (51.3) | 27 (57.5) | 0.730 |
| Overweight | 32 (38.1) | 14 (37.8) | 18 (38.3) | 1.000 |
| Obesity | 6 (7.1) | 4 (11.0) | 2 (4.2) | 0.390 |
| Comorbidities (%) | - | - | - | - |
| Diabetes Mellitus | 4 (4.8) | 2 (5.4) | 2 (4.3) | 1.000 |
| Metabolic syndrome | 12 (14.3) | 10 (27.0) | 2 (4.3) | 0.004 |
| Vitamin D status (%) | - | - | - | - |
| <30 (ng/dL) | 66 (79.5) | 32 (86.5) | 34 (74.0) | 0.182 |
| <20 (ng/dL) | 37 (44.6) | 21 (56.8) | 16 (24.8) | 0.075 |
| Increased SHBG (%) | 27 (31.2) | 16 (43.2) | 11 (23.4) | 0.054 |
| Laboratory tests (Median IQ:25-75) | - | - | - | - |
| Total testosterone (ng/dL) | 396.5 (314.8-490.2) | 327.0 (267.0-402.0) | 444.0 (390.0-511.0) | < 0.001 |
| SHBG (nmol/L) | 45.4 (35.1-60.2) | 50.2 (32.7-65.8) | 44.4 (35.7-55.1) | 0.169 |
| Calculated free testosterone (ng/dL) | 6.6 (5.3-7.4) | 5.0 (4.5-5.9) | 7.3 (6.8-9.4) | <0.001 |
Abbreviations: TD: testosterone deficiency; HIV: human immunodeficiency virus; ART: antiretroviral therapy;
BMI: body mass index; WC: waist circumference WHtR: waist-to-height ratio; IDF: International Diabetes Association; NCEP: National
Cholesterol Education Program; PTH: parathyroid hormone; 25(OH)D3: 25 OH vitamin D; SHBG: sex hormone binding globulin
| - | All (72) | With TD (32) | Without TD (40) | p-value |
|---|---|---|---|---|
| Bone mass (Median IQ:25-75) | - | - | - | - |
| BMD L1-L4 (g/cm2) | 1.1 (1.0 - 1.2) | 1.1 (1.0 - 1.2) | 1.1 (1.0 ; 1.2) | 0.567 |
| T-score L1-L4 | -1.2 (-1.5 ; -0.3) | - 1.2 (-1.6 ; -0.3) | -1.2 (-1.5 ; -0.4) | 0.878 |
| Z-score L1-L4 | -1.1 (-1.4 ; 0.1) | -1.1 (-1.5 ; 0.1) | -1.0 (-1.4 ; -0.3) | 0.489 |
| BMD femoral neck (g/cm2) | 1.0 (0.9 - 1.1) | 1.0 (0.9 ; 1.1) | 1.0 (0.9 ; 1.1) | 0.316 |
| T-score femoral neck | -0.8 (-1.5 ; -0.1) | -0.6 (-1.5 ; -0.2) | -0.9 (-1.4 ; -0.1) | 0.748 |
| Z-score femoral neck | -0.1 (-0.7;0.3) | -0.2 (-0.7 ; 0.3) | -0.1 (-0.7 ; 0.4) | 0.682 |
| BMD total femur (g/cm2) | 1.0 (0.9 - 1.1) | 1.0 (0.9 - 1.1) | 1.0 (0.9 ; 1.1) | 0.895 |
| T-score total femur | -0.6 (-1.2 ; 0.0) | -0.6 (-1.3 ; 0.0) | -0.7 (-1.2 ; -0.1) | 0.847 |
| Z-score total femur | 0.9 (0.9 - 1.0) | -0.4 (-0.8 ; 0.1) | -0.3 (-0.7 ; 0.1) | 0.574 |
| BMD distal radius third (g/cm2) | 0.9 (0.9 - 1.0) | 0.9 (0.9 - 1.0) | 0.9 (0.9 ; 1.0) | 0.469 |
| T-score distal radius third | -0.7 (-1.3 ; -0.1) | -0.8 (-1.4 ; 0.0) | -0.5 (-1.1 ; -0.1) | 0.557 |
| BMD ultradistal radius (g/cm2) | 0.5 (0.4 - 0.5) | 0.5 (0.4 - 0.5) | 0.5 (0.4 ; 0.6) | 0.074 |
| T-score ultradistal radius | -0.8 (-1.6 ; 0.4) | -1.1 (-1.8 ; -0.2) | -0.6 (-1.5 ; 0.9) | 0.065 |
| Bone mass classification (%) | - | - | - | - |
| Normal BM | 39 (54.2) | 12 (37.5) | 27 (67.5) | 0.021 |
| Low BM for age | 4 (5.5) | 0 | 4 (10.0) | 0.120 |
| osteopenia | 22 (30.5) | 16 (50) | 6 (15.0) | 0.003 |
| osteoporosis | 7 (9.7) | 4 (12.5) | 3 (7.5) | 0.690 |
| Lipodystrophy (%) | - | - | - | - |
| Lipohypertrophy | 33 (39.8) | 17 (45.9) | 16 (34.8) | 0.307 |
| Lipoatrophy | 17 (23.6) | 6 (18.8) | 11 (27.5) | 0.392 |
| Total (LH and/or LA) | 45 (53.6) | 21 (56.8) | 24 (51.1) | 0.609 |
| Lean mass (Median IQ:25-75) | - | - | - | - |
| Appendicular lean mass (kg) | 23.6 (21.1- 26.1) | 23.4 (20.9 - 26.0) | 24.2 (21.2 - 26.1) | 0.961 |
| Baumgartner (kg/m2) | 8.1 (7.2 - 9.0) | 7.8 (7.1 - 9.2) | 8.2 (7.4 - 8.9) | 0.590 |
| FNIH | 1.0 (0.9 - 1.1) | 0.9 (0.9 - 1.1) | 1.0 (0.9 - 1.1) | 0.316 |
| Lean mass classification (%) | - | - | - | - |
| Baumgartner (kg/m2) | 20 (27.7) | 11 (33.0) | 9 (23.0) | 0.480 |
| FNIH | 4 (5.5) | 2 (6.3) | 2 (5.0) | 1.000 |
| Fat mass (Median IQ:25-75) | - | - | - | - |
| Trunk fat percentage | 14.8 (11.7 - 18.2) | 15.6 (12.2 - 19.2) | 14.5 (10.0 - 17.6) | 0.210 |
| Leg fat percentage | 18.8 (14.8 - 23.7) | 21.4 (15.8 - 25.9) | 18.1 (13.9 - 22.0) | 0.109 |
| FMR | 1.6 (1.2 - 3.3) | 1.5 (1.2 - 2.1) | 1.5 (1.3 - 1.8) | 0.711 |
| FMI (kg/m2) | 5.3 (4.0 - 7.2) | 5.8 (4.3 - 8.4) | 5.2 (3.9 - 6.7) | 0.056 |
| A/G | 1.4 (1.1 - 1.7) | 1.3 (1.1 - 1.6) | 1.5 (1.3 - 1.8) | 0.162 |
| Fat mass classification (%) | - | - | - | - |
| Increased FMI | 27 (38.6) | 15 (48.4) | 12 (30.8) | 0.136 |
| Increased A/G | 57 (81.4) | 25 (80.6) | 32 (82.1) | 0.881 |
Abbreviations: TD: testosterone deficiency; BMD: bone mineral density; BM: bone mass; FNIH: Foundation for the National Institutes of Health; FMR: fat mass ratio; FMI: fat mass index; A/G: android gynoid ratio (A/G).
Using the cFT criterion, and comparing groups with and without TD, those with TD were older (50 vs. 45 years, p < 0.01), had a higher frequency of MS (27% vs. 4.3%, p < 0.01), a higher frequency of increased WC (21.6% vs. 4.3%, p <0.05), lower frequency of normal BM (37.5% vs. 67.5%, p <0.05), and higher frequency of osteopenia (50% vs. 15%, p < 0.05). There was no difference between groups in relation to CD4 count, duration, or type of ART, frequency of low lean mass, lipodystrophy, or fat mass.
When evaluating the correlation between cFT levels and the analyzed variables, a positive correlation was observed with the T-score of the ultradistal radius (R = 0.25, p = 0.031) and with the BMD of the ultradistal radius (R = 0.23, p = 0.047). Negative correlations were found with Waist Circumference (WC) (R = -0.25, p = 0.021) and age (R = -0.30, p = 0.005).
4. DISCUSSION
In this observational cross-sectional study, the frequency of TD in MLWHIV was evaluated using two criteria, the levels of TT and cFT. We also verified metabolic dysfunctions and body composition, as assessed by DXA, in groups with and without TD. Most of the included men were middle-aged and had been using ART for more than 2 years.
Comparing the cFT and TT, a higher frequency of TD diagnosis was observed when using the first criterion, 44% vs. 22.6% (p <0.001) (Fig. 1). Monroe et al. observed that, in MLWHIV, the use of TT alone would lead to a loss of TD diagnosis in 30% of the sample [25]. Pezzaioli et al. also compared the two criteria and found a frequency of 20.2% versus 10.6% when using the cFT and TT criteria, respectively [26]. Using cFT, twice as many participants were diagnosed with TD. Most studies in the post-ART era have assessed the frequency of TD using mixed criteria, including TT and/or cFT values. TT levels to determine TD were variable, from 280 to 346 ng/dL. Regarding cFT, most authors used values <6.5 ng/dL. The non-standardization of criteria implies a large variability in the prevalence of TD in MLWHIV., Using mixed criteria, we observed a variation from 8.7% to 34.5% [8, 9, 25-31]. Aggarwal et al. measured cFT using the Enzyme-linked Immunosorbent Assay (ELISA) technique and found a frequency of 66% TD in MLWHIV [27]. Data from these studies are compiled in Table 3.
Previous studies have demonstrated a direct relationship between CD4 count and testosterone levels [9, 27, 29, 32]. Lachâtre et al. reported an inverse correlation between CD4 nadir and testosterone deficiency, with values above 200 cells/mm3 acting as a protective factor [8]. However, in the present study, neither CD4 count nor CD4 nadir was associated with cFT levels. One possible explanation is that all participants had undetectable viral loads and satisfactory CD4 counts, resulting in a relatively homogeneous sample in terms of viral suppression.
We did not observe an association between the time of HIV diagnosis, the duration of ART, the type of ART, and TD. Previous studies have also not found any association between these parameters [28, 29]. However, in the study by Lachâtre et al. greater exposure to ART, regardless of the class used, was associated with TD [8].
Regarding age, the present study corroborated that increasing age is associated with an increase in the prevalence of TD, which also occurs in the non-HIV-infected population. Slama et al. looked at cFT levels in 499 men (182 HIV-infected and 267 HIV-uninfected) over a 10-year period and observed a 1.2% per year decline in these levels in both groups [33].
| Author's name | Year of Publication | Number of Participants | Prevalence of TD | Diagnostic Criteria |
|---|---|---|---|---|
| Monroe et al. [25] | 2014 | 364 | 9.3% | TT<300 ng/dL or cFT <5 ng/dL |
| Gomes et al. [28] | 2016 | 245 | 29.4% | TT <280 ng/dL and/or cFT <6.5 ng/dL |
| Bajaj et al. [9] | 2017 | 81 | 25.9% | TT <300 ng/dL |
| Aggarwal et al. [27] | 2018 | 100 | 66% | TL <0.384 ng/dL |
| Pongener et al. [29] | 2019 | 120 | 23.3% | TT<300 ng/dL |
| Postel et al. [30] | 2021 | 87 | 34.5% | FT < 6.5 ng/dL |
| Pezzaioli et al. [26] | 2021 | 94 | 10.6% pela TT 20.2% pela TLc |
TT <346 ngdL or cFT<6.5 ng/dL |
| Quiros-Roldan et al. [31] | 2021 | 107 | 30.8% | TT ≤346 ng/dL or cFT ≤6.5 ngldL |
| Lachâtre et al. [8] | 2022 | 231 | 8.7% | cFT<7.0 ng/dL |
Our data demonstrate a 27% frequency of metabolic syndrome (MS) in the TD group, and we also observed an association between these conditions. However, these findings are conflicting in the literature. Gomes et al. found a frequency of MS of 45.8% in 72 HIV-positive individuals with TD; however, they did not find differences in the frequency of MS comparing groups with and without TD [28]. Lachâtre et al. found a frequency of MS of 10% in 20 HIV-positive individuals with TD and found no difference in the frequency of MS between the groups with and without TD [8]. Nevertheless, low testosterone levels in men are associated with an increased risk of developing metabolic syndrome regardless of BMI or insulin resistance [34]. The mechanism is still uncertain, but it is suggested that it is bidirectional; hypogonadism increases the risk of metabolic syndrome and vice versa [35].
Lipodystrophy is an adverse event associated with the continuous use of ART; its frequency in people living with HIV varies from a small percentage to 80% [36]. This variability occurs due to the use of different methodologies to characterize lipodystrophy. In this study, we employed direct methods, including DXA and abdominal adiposity measurements, to assess lipodystrophy and observed a frequency of 56.8% in men with TD; however, we did not find an association between TD and lipodystrophy. Fat mass ratio has also been proposed in the HIV population as a criterion for lipodystrophy [23]; nonetheless, there is no defined cut-off for diagnosis. In this study, we did not observe an association between FMR and TD. Gomes et al. also found no association between testosterone deficiency and lipodystrophy when comparing 72 MLWHIV and TD with 173 MLWHIV without TD; however, WC values > 102 cm were more frequent in the TD group [28]. The current study also demonstrated an association between TD and WC > 102cm, in addition to an inverse correlation between WC and cFT levels, which suggests that this criterion may be a predictor of TD in MLWHIV.
The TD group showed a lower frequency of normal bone mass and a higher frequency of osteopenia. No differences were observed in relation to other factors that influence of bone mass, such as levels of 25-hydrovitamin-D, PTH, renal function, or smoking. Goh et al. carried out a systematic review to evaluate the risk factors associated with reduced bone mass in people living with HIV, and an association was demonstrated between low testosterone levels and reduced BMD [37]. According to a study by Abreu et al., it was demonstrated that MLWHIV with hypogonadism have a 5.9 times greater risk of low bone mass than those with normal cFT levels [38].
In this study, both BMD and ultradistal radius T-score showed a weak positive correlation with cFT levels. Studies carried out in patients with hypogonadism secondary to the use of GnRH analogues due to prostate cancer showed a loss of bone mass mainly at the site of the ultradistal radius, where there is a predominance of trabecular bone in relation to cortical bone [39, 40].
People living with HIV have a higher prevalence of low lean mass than controls without HIV, which has been estimated at 28.8% [41]. Our data did not show an association between TD and low lean mass in MLWHIV. A recent meta-analysis selected studies that investigated factors associated with low lean mass, as analyzed by DXA; however, TD was not among the predictors evaluated in these studies [42]. In addition to our study, we are unaware of any other publication that has studied the association between low lean mass, as assessed by DXA, and low cFT levels.
Increased fat mass was associated with hypogonadism [6]. However, we found no association between TD and increased fat mass quantified by FMI or A/G ratio. Lachâtre et al. who studied MLWHIV, also did not find any difference in the percentage of body fat assessed by DXA when comparing groups with and without TD [8]. However, they found a correlation between a fat percentage >19% and hypogonadism, which suggests that this parameter can be used to identify MLWHIV at risk of hypogonadism [8].
5. LIMITATIONS OF THE STUDY
There were limitations to our study. First, external validity is a concern, because this was a single-center, hospital-based sample with well-controlled HIV infection, and it may have differed from the typical MLWHIV in the community. Second, the cross-sectional design limited us to describing associations and not to elaborating causal relationships.
We observed many controversies in the literature regarding the changes associated with TD in MLWHIV, especially in middle-aged individuals. More prospective studies are needed to evaluate metabolic dysfunctions and changes in body composition in MLWHIV and TD.
CONCLUSION
The frequency of TD in MLWHIV was 44% when using the cFT criterion. The cFT criterion identified twice as many participants with TD as with TT. Its diagnosis was associated with harmful conditions such as metabolic syndrome, changes in bone mass, and greater abdominal circumference, which suggests the importance of screening for TD and the use of cFT for its diagnosis; however, further studies are needed to support the use of this method as a diagnostic criterion.
AUTHORS CONTRIBUTIONS
The authors confirm contribution to the paper as follows: D.V.S.: Study conception and design; A.B.B.N.: Data collection; L.G.C. V.: Analysis and interpretation of results; L.d.S.A., L. H.M.S.; Data curation; J.M.A.: Draft manuscript preparation; D.V.S, G.A.B. L., R.A.d.C.F.: Review and editing;. All authors reviewed the results and approved the final version of the manuscript.
LIST OF ABBREVIATIONS
| AIDS | = Acquired Immunodeficiency Syndrome |
| A/G | = Android Gynoid Ratio |
| ALM | = Appendicular Lean Mass Index |
| ART | = Antiretroviral therapy |
| BM | = Bone Mass |
| BMD | = Bone Mineral Density |
| BMI | = Body Mass Index |
| cFT | = calculated Free Testosterone |
| DXA | = Dual-energy X-ray absorptiometry |
| DM | = Diabetes Mellitus |
| FM | = Fat Mass |
| FMI | = Fat Mass Index |
| FMR | = Fat Mass Ratio |
| FN | = Femoral Neck |
| IDSA | = Infectious Diseases Society of America |
| HIV | = Human Immunodeficiency Virus |
| LA | = Lipoatrophy |
| LM | = Lean Mass |
| LH | = Lipohypertrophy |
| MLWHIV | = Men Living With HIV |
| MS | = Metabolic Syndrome |
| NC | = Neck Circumference (NC) |
| NCEP ATPIII | = National Cholesterol Education Program Adult Treatment Panel III) |
| SHBG | = Sex Hormone Binding Globulin |
| TD | = Testosterone Deficiency |
| TF | = Total Femur |
| TT | = Total Testosterone |
| UD | = Ultradistal Radius |
| WC | = Waist Circumference |
| WHtR | = Waist-to-Height Ratio |
| 25 (OH)D3 | = 25-OH vitamin D TOTAL |
ETHICS APPROVAL AND CONSENT TO PARTICIPATE
The study was approved by the Research Ethics Committee of the University Hospital Antonio Pedro, Brazil (CAAE 17322613.9.0000.5243).
HUMAN AND ANIMAL RIGHTS
All human research procedures followed were in accordance with the ethical standards of the committee responsible for human experimentation (institutional and national), and with the Helsinki Declaration of 1975, as revised in 2013.
AVAILABILITY OF DATA AND MATERIALS
The data and supportive information are available within the article.
FUNDING
This study was funded by Fundacao Carlos Chagas Filho de Amparo a Pesquisa do Estado do Rio de Janeiro (FAPERJ) [(process number E-26/190.266/2014 (ADT-1)].
ACKNOWLEDGEMENTS
Declared none.